

Think of your profit and loss statement as the financial story of your business over a specific period. It’s a straightforward tale of what you earned versus what you spent, all leading to the most important number: your net profit or loss. Getting comfortable with this report is the first real step toward making smarter, more confident business decisions.
Your Guide to Understanding a Profit and Loss Statement
Before we get into the nitty-gritty, let's be clear on what a Profit and Loss (P&L) statement actually is. You might also hear it called an income statement, but it does the same job: it summarises your revenues, costs, and expenses over a specific timeframe—be it a month, a quarter, or a full year.
At its core, the P&L answers one simple but vital question: is the business actually making money?
For any owner or manager, this document is so much more than a box-ticking exercise for the accountant. It’s your financial scorecard. It shows you exactly where your money came from (your revenue) and precisely where it went (your expenses), culminating in that all-important 'bottom line'.
This flowchart gives you a bird's-eye view of how the pieces fit together.
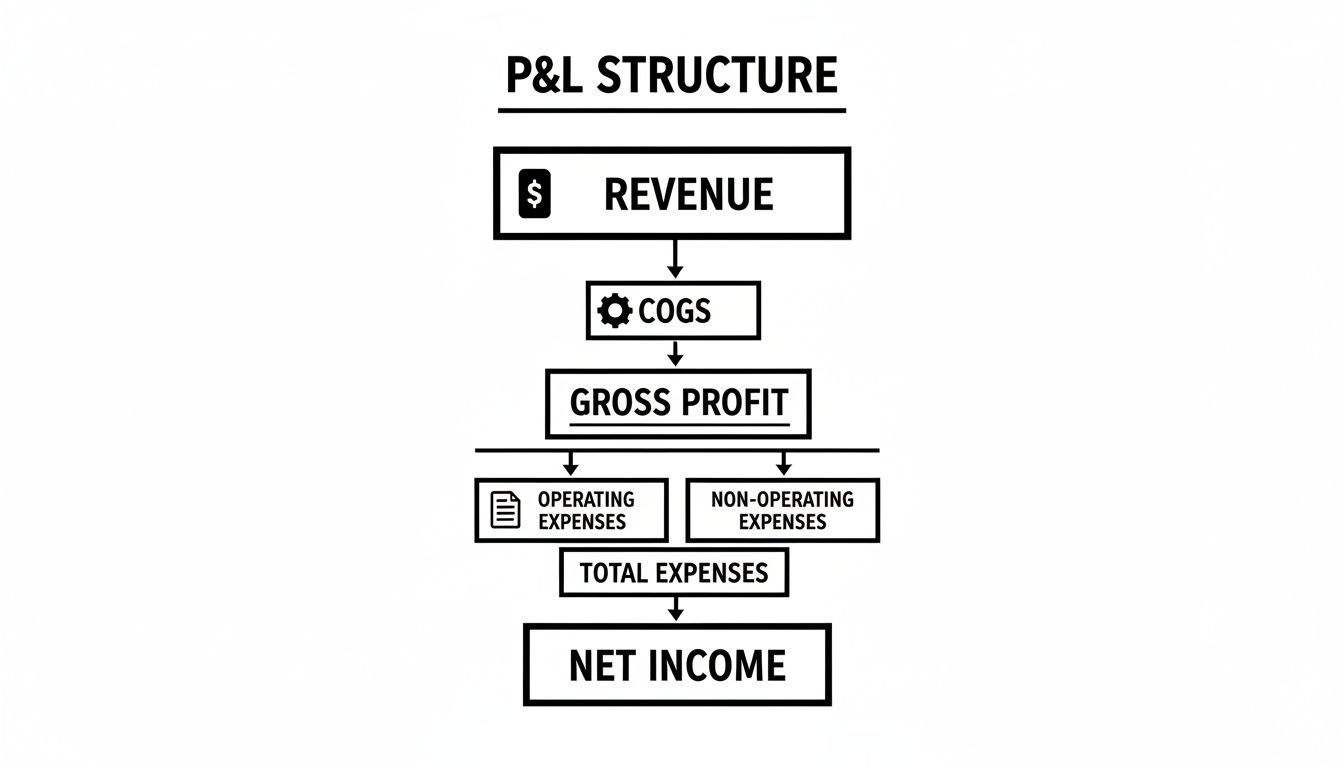
As you can see, it’s a logical flow from top to bottom. Costs are subtracted at each key stage to show different measures of profitability. Grasping this structure is the key to reading a P&L with any real confidence.
The Three Core Components
To really start making sense of your P&L, you need to get your head around its three foundational pillars. Everything else you see on the statement is built on these.
-
Revenue: This is your 'top line' – the total amount of money you’ve earned from selling your products or services. Crucially, this is before a single cost has been taken out. It’s the fuel for your business.
-
Cost of Goods Sold (COGS): These are the direct costs of making what you sell. If you run a coffee shop, this is your coffee beans, milk, and paper cups. For a software developer, it might be the server hosting costs for a specific client’s application.
-
Expenses: Think of these as the cost of keeping the lights on. They’re the operational costs that aren't directly linked to a specific sale, like office rent, staff salaries, marketing spend, and insurance.
The P&L isn’t just a look in the rearview mirror; it's a diagnostic tool. By splitting out your direct costs (COGS) from your general running costs (Expenses), you can instantly judge how profitable your core business offering is, separate from how efficiently you're running the company itself.
The table below breaks down these core sections and explains what they tell you about your business's performance.
Key Components of a Profit and Loss Statement
| P&L Component | What It Measures | Why It Matters for Your Business |
|---|---|---|
| Revenue (Sales) | Total income generated from primary business activities. | It's the starting point for profitability. Growing revenue is a primary goal for most businesses. |
| Cost of Goods Sold (COGS) | The direct costs attributable to producing goods or services. | Shows the direct cost of sales. High COGS can squeeze your gross profit margin. |
| Gross Profit | Revenue minus COGS. | Reveals the profitability of your core products/services before overheads are considered. |
| Operating Expenses | All costs of running the business, excluding COGS. | Highlights your overheads. Keeping these in check is crucial for improving your bottom line. |
| Net Profit (Bottom Line) | The final profit after all expenses, including taxes, are deducted. | This is the ultimate measure of profitability and the true 'take-home' for the business. |
Getting a solid handle on these three components gives you the context you need to interpret the rest of the statement.
Of course, the P&L is just one piece of the financial puzzle. For a complete picture, it’s worth learning how to read financial statements as a whole. This broader skill helps you connect the dots between your profitability (P&L), your assets and liabilities (Balance Sheet), and your cash movements (Cash Flow Statement), giving you a truly three-dimensional view of your company’s health.
Getting to Grips with Revenue and Cost of Goods Sold
Let’s start at the top. The first part of your profit and loss statement is all about what you’ve earned and what it directly cost you to earn it. Think of this as the engine room of your business – it sets the stage for everything else.

Right at the top, you'll see your total revenue, which you might also know as sales or turnover. This number is the total amount of money your business has brought in from selling its goods or services, before taking anything away. It’s the raw fuel for your business, but the real story is never just about that single figure.
You need to dig a little deeper. Is that revenue figure growing steadily each month, or does it jump around? Are you seeing seasonal peaks and troughs? More importantly, which specific products or clients are actually driving that number? Answering these questions turns a simple number into a powerful strategic tool.
What is the Cost of Goods Sold (COGS)?
After you've looked at your revenue, the next line you’ll usually see is the Cost of Goods Sold (COGS). This is a crucial one. Understanding COGS is what separates a business that’s just busy from one that’s actually making money.
COGS includes every single cost directly tied to producing what you sell. It’s vital not to mix this up with your general overheads like rent, marketing, or admin salaries. Those come later.
- For a local bookshop: COGS would be the wholesale price of the books, plus any delivery charges to get them into the shop.
- For a web developer: This could include the direct labour costs of the hours spent coding a client's website or the cost of a specific software plug-in bought just for that project.
- For a joiner: It’s the timber, screws, glue, and the wages for the time spent building a bespoke wardrobe.
Getting your COGS figure right is fundamental to understanding your real profitability. If you need a more detailed breakdown, have a look at our guide on how to calculate Cost of Goods Sold to make sure you're on the right track.
Finding Your Gross Profit
Once you have your revenue and your COGS, you can calculate your first major profitability metric: Gross Profit. The formula couldn't be simpler.
Gross Profit = Total Revenue – Cost of Goods Sold (COGS)
This figure tells you exactly how much money is left over from your sales after you've paid the direct costs to produce them. It's a fantastic, high-level health check on your core business model, long before you start thinking about overheads.
Let’s take a local coffee shop as an example. Say it brings in £15,000 in a month (Revenue). The cost of coffee beans, milk, sugar, takeaway cups, and the barista’s wages totals £6,000 (COGS). The shop's Gross Profit is therefore £9,000. That £9,000 is what’s now available to cover the rent, business rates, marketing, and, with any luck, leave a healthy profit.
Why You Should Track Your Gross Profit Margin
While the gross profit figure is great, the Gross Profit Margin gives you even more insight. By turning it into a percentage, it shows you how profitable each pound of revenue really is.
The calculation is: (Gross Profit / Total Revenue) x 100
For our coffee shop: (£9,000 / £15,000) x 100 = 60%. This means that for every £1 the shop makes in sales, 60p is left over as gross profit.
Watching this percentage is essential. If you see it start to slip, it's an early warning sign. It could mean your supply costs are creeping up faster than your prices, or perhaps you need to rethink your pricing strategy altogether. For any small business, getting this top half of the P&L right is a genuine game-changer.
Understanding this breakdown is often the difference between success and failure. Recent UK business stats show that while 67% of UK SMEs turned a profit in Q4 2023, a significant 14% were still running at a loss. Profitability can vary wildly between sectors—the median SME profit was £13,000, but this dropped to just £11,000 for wholesale and retail businesses, showing just how important tight cost control is.
By decoding your revenue and COGS, you get an honest picture of how well your business generates profit from its core activities. This clarity gives you the confidence to analyse the rest of your P&L and make truly informed decisions.
Navigating Operating Expenses to Find Your True Profit
So, you’ve worked out your gross profit. That number tells you a lot about how profitable your products or services are on their own, but it doesn't tell the whole story. Now we need to factor in what it costs to actually run your business day-to-day. This is where Operating Expenses (OPEX) come in.
Think of OPEX as all the costs you incur just to keep the lights on, the team paid, and the marketing engine running. These are the expenses that aren't directly linked to producing a single product or delivering one service. Getting a solid grip on these figures is how you uncover your company's real, sustainable profitability.
Common Categories for Operating Expenses
To stop your P&L from just being a long, confusing list of costs, we group operating expenses into logical categories. The exact names might differ slightly from business to business, but you’ll almost always see some version of these:
- Selling, General & Administrative (SG&A): This is a bit of a catch-all but it’s a crucial one. It covers everything from staff salaries and office rent to the fees you pay your accountant or solicitor.
- Marketing and Advertising: This bucket holds all the money you spend to get your name out there – think Google Ads, social media campaigns, website hosting, or even printing flyers.
- Utilities and Rent: These are the fundamental costs of having a place to work, whether it’s a physical office or just a digital presence. This includes electricity, internet, and business rates.
- Software and Subscriptions: For most modern businesses, this list is getting longer every year. It’s home to everything from your accounting software and CRM to project management tools like Asana or Trello.
Sorting your costs correctly isn’t just a bookkeeping chore; it’s a strategic one. For example, knowing the difference between your fixed and variable costs can tell you a huge amount about your financial resilience. We've got a practical guide on how to do this in our article on identifying fixed vs. variable costs in Xero.
From Gross Profit to Operating Profit
Once you've listed and categorised all your operating expenses, you simply add them up. Then, subtract that total from your gross profit. What you’re left with is your Operating Profit. You might also see this called Operating Income or EBIT (Earnings Before Interest and Tax).
Operating Profit = Gross Profit – Total Operating Expenses
This is one of the most important numbers on your entire P&L. It shows you exactly how much money your core business activities are making, before you account for things like loan interest or taxes. A healthy operating profit is a fantastic indicator that your business model is sound.

Most accounting software, like Xero, presents this clearly, making it easy to see where your biggest overheads are at a glance.
Reaching the Famous Bottom Line: Net Profit
We’re almost there. After calculating operating profit, there are just a couple more items to deal with before we hit that famous final number. These are often called 'non-operating' items because they relate to finance and tax, not your core operations.
- Interest: This is where you account for any interest you've paid on business loans or other debts.
- Taxes: This line shows the provision for Corporation Tax that your business owes on its profits.
Deduct these two from your operating profit, and you finally arrive at the Net Profit—the ultimate 'bottom line'.
Net Profit = Operating Profit – Interest – Taxes
This is the true measure of profitability. It’s the cash left over after every single bill has been paid. A positive net profit is what allows you to reinvest in growth, pay dividends, or simply build a healthy cash reserve for the future.
Why Net Profit Margin is a Crucial KPI
Just as we did with gross profit, we can turn your net profit figure into a much more insightful percentage: the Net Profit Margin.
The calculation is straightforward: (Net Profit / Total Revenue) x 100
This simple KPI tells you how much actual profit you make for every pound that comes through the door. For instance, a net profit margin of 15% means that for every £1 in sales, you get to keep 15p as pure profit.
Tracking this metric over time is one of the best ways to judge your company's overall financial health. Once you have a clear picture of your operating expenses, you can start looking for strategies for understanding and minimizing business expenses to give that margin a healthy boost.
Using Your P&L to Spot Trends and Measure Performance
A single profit and loss statement is a useful snapshot, but it only tells you what’s happening at one specific moment. The real magic happens when you start comparing these snapshots over time. This is what we call trend analysis, and it’s how you move from just reading a report to truly understanding the story your business is telling.

It’s by looking at the patterns that you spot the things that can make or break your business. Are your revenues climbing steadily month after month? Or are certain expenses quietly creeping up and eating away at your profit? When you lay your P&L reports side-by-side, these crucial insights practically jump off the page.
Performing Comparative Analysis
The best place to start is with direct comparison. Never look at one month in isolation. You need context, and that comes from comparing the numbers to other key periods. This is just fundamental to good financial housekeeping.
Here are the most common and useful comparisons I recommend:
- Period-over-Period: This is where you compare one period directly against the one that came just before it—this month versus last month, or this quarter versus the last one. It’s perfect for spotting short-term changes and seeing the immediate impact of your decisions.
- Year-over-Year: This one involves looking at a period this year against the exact same period last year (say, July 2024 versus July 2023). This is the best way to identify seasonal trends and measure genuine, long-term growth because it smooths out any random monthly wobbles.
Think about it this way: a retailer comparing December to November will obviously see a huge sales spike. That doesn't tell them much. But comparing this December to last December? That reveals if their Christmas trading was actually more successful. It's a far more meaningful measure of performance.
Key Financial Ratios from Your P&L
Beyond direct comparisons, your P&L is a goldmine for calculating essential financial ratios. These are your vital signs, turning raw numbers into standardised metrics you can track over time and even check against competitors.
Learning how to calculate and interpret these ratios is what separates someone who just glances at a P&L from someone who truly understands it.
By consistently calculating these key performance indicators (KPIs), you essentially create a financial health dashboard for your business. A sudden dip in one of these margins is an immediate red flag that tells you exactly where to start digging.
Here are the three most important profitability margins you'll get straight from your P&L:
- Gross Profit Margin: This tells you how profitable your core products or services are, before any overheads. A healthy, stable gross margin shows your pricing strategy and direct costs are under control.
- Operating Profit Margin: This measures the efficiency of your day-to-day business. It shows how much profit you’re making from your core operations before interest and tax are factored in.
- Net Profit Margin: This is the ultimate bottom line. It reveals what percentage of revenue is left as pure profit after every single expense, including interest and taxes, has been paid.
Keeping a close eye on these metrics is a core part of the strategies we cover in our guide to management reporting best practices, which is all about turning data into smart, actionable decisions.
Benchmarking for Context
So you understand your own trends, which is great. But how do you know if your performance is actually any good? This is where benchmarking comes in. It's about comparing your P&L ratios against your own history, the targets in your business plan, or even industry averages.
This wider context helps you set realistic goals. For example, recent ONS data showed that UK private non-financial corporations had a net rate of return of 10.3% in 2024. But that number hides the details: manufacturing climbed to 11.7% while services were higher but flat at 15.2%. Knowing where your sector stands helps you properly interpret your own net profit margin.
By combining trend analysis, key ratios, and benchmarking, you’ll transform your P&L from a simple accounting document into a powerful strategic tool. It gives you the clarity you need to steer your business with confidence.
Watch Out for These Common P&L Mistakes
A profit and loss statement is only as good as the numbers you put into it. A few seemingly small errors can completely throw off your financial picture, leading you to make bad calls that could hold your business back. I've seen it happen time and time again. Knowing how to read a P&L properly also means knowing what common tripwires to look out for.
Getting these details right turns your P&L from a historical document into a reliable tool for steering your business.
Putting Costs in the Wrong Bucket: COGS vs. OPEX
One of the most common—and most damaging—mistakes is mixing up your Cost of Goods Sold (COGS) and your Operating Expenses (OPEX). Get this wrong, and you'll completely miscalculate your gross profit and gross margin, giving you a warped view of how profitable your core operations really are.
It’s simple, really. COGS are the direct costs of making your product or delivering your service. Think raw materials or the wages of the person physically providing the service. OPEX, on the other hand, are the general costs of keeping the lights on—rent, marketing, admin salaries.
Let’s take a small software development company as an example. The salary of a developer working directly on a client’s project? That’s COGS. But the salary of the office manager who keeps the whole operation running smoothly? That's an operating expense. If you accidentally stick the office manager's salary in COGS, you’ll shrink your gross profit on paper, making your core development work seem far less profitable than it truly is.
Here’s a great rule of thumb I always use: Ask yourself, "Would this cost exist if we hadn't made this specific sale?" If the answer is no, it's almost certainly a direct cost (COGS). If the answer is yes, it's an operating expense.
Forgetting About the “Invisible” Expenses
Your P&L isn't just a record of cash changing hands. It also needs to reflect non-cash expenses, and the big one everyone forgets is depreciation. This is just the accounting way of spreading the cost of a major asset, like a delivery van or a new server, over its useful life.
You might have paid for that van in full last year, but you don't hit your P&L with the entire cost in one go. Instead, you expense a portion of its value each year. If you forget to include depreciation, you're overstating your profit. That might feel good in the short term, but it can lead to a nasty surprise when you get your tax bill.
Amortisation is the same concept but for intangible assets, like a software licence or a patent. Ignoring these non-cash items gives you a falsely optimistic—and inaccurate—view of your business's health.
Getting the Timing of Your Revenue Wrong
When you recognise revenue has a massive impact on your P&L, especially if you're using accrual accounting (which most businesses should be). With accrual accounting, you record revenue when it's earned, not when the client actually pays you.
Imagine your marketing agency finishes a three-month project in March, but the client doesn't settle the £10,000 invoice until May. That income was earned in March, so it belongs on March's P&L. If you wait until the cash hits the bank in May, you'll make March look like a poor month and May look artificially good. This completely skews your period-by-period performance and makes it impossible to see real trends.
Navigating Tricky Scenarios for Your Business Type
Some businesses have their own unique P&L quirks. Getting these wrong can lead to more than just bad data; it can cause real headaches with the tax man.
-
For Property Landlords: A classic slip-up is how you handle maintenance. Fixing a tenant's leaky tap is a simple repair—an operating expense that hits the P&L straight away. But replacing the entire roof is a major capital improvement. That cost should be capitalised and depreciated over many years, not expensed all at once.
-
For Limited Companies: I often see directors confusing their own salaries with dividends. A salary is an operating expense; it reduces your profit before you calculate Corporation Tax. A dividend, however, is a distribution of profit after tax has already been paid. If you record a dividend payment as a salary, you're illegally lowering your tax bill, and that’s a sure-fire way to attract unwanted attention from HMRC.
By sidestepping these common blunders, you can trust that your P&L is a precise and reliable guide for making the right decisions for your business.
Turning P&L Insights into Actionable Growth Strategies
Learning to read your profit and loss statement is a critical first step. But the real magic happens when you start using those numbers to make smarter decisions. A P&L isn't just a historical document; it's your financial roadmap.
The insights you've pulled from your P&L are the foundation for a real, data-driven growth plan. It’s time to stop just looking at the report and start actively pulling the levers it reveals—whether that’s finding new ways to make money or getting a handle on your spending.
Find New Opportunities for Revenue Growth
Your P&L can tell you some surprising truths about where your money really comes from. Don’t just glance at the total revenue; dig into the details of your different income streams and compare them against your gross profit margin.
You might discover certain services or products are vastly more profitable than others. For many business owners, this is a genuine lightbulb moment. Once you know what your most profitable offerings are, you can double down on what’s already working.
This might look like:
- Rethinking your pricing: Is a bestseller actually squeezing your gross margin? It could be a clear signal that it's time for a price review.
- Focusing your marketing budget: Instead of a scattergun approach, you can redirect your advertising spend to promote the high-margin products that truly boost your bottom line.
- Developing new premium offers: Your P&L data can show you what your best customers value, giving you the perfect insight to create new, higher-value services.
Your P&L doesn’t just show what you’ve sold; it tells you what you should be selling more of. The numbers cut through gut feelings and show you the clearest path to better overall profitability.
Make Smarter Decisions on Cost Reduction
Just as important is what the P&L tells you about your expenses. Seeing all your operating costs laid out in black and white allows for targeted, intelligent cost control—not just frantic budget-slashing that might hurt the business.
Are your software subscriptions creeping up every month? Did your raw materials cost suddenly jump? The P&L flags these issues immediately.
Use these insights to take specific, informed actions. For instance, if you spot rising utility bills, you can start exploring more energy-efficient equipment. If you notice a marketing channel is costing a fortune but isn’t moving the needle on revenue, you know exactly where to trim the fat without hurting sales.
This is where modern cloud accounting tools like Xero are so powerful. They generate your P&L automatically, giving you the real-time data you need to make these kinds of agile decisions. This whole process helps you build a leaner, more resilient, and ultimately, a more profitable business.
Common Questions Answered
How often should I actually look at my profit and loss statement?
For most business owners I work with, a monthly review is the perfect rhythm. It's frequent enough to spot a trend or a problem before it gets out of hand, but not so often that you get bogged down in the day-to-day noise.
If your business is in a particularly fast-paced sector, like e-commerce or hospitality, a quick weekly glance at the key numbers in your accounting software is a very smart move. You don’t need a full-blown analysis every Friday, but keeping an eye on revenue and key expenses can make a huge difference.
What’s the real difference between a P&L and a Balance Sheet?
It all comes down to time. The P&L tells you a story over a period of time – a month, a quarter, a year. It shows you the money that came in (revenue) and the money that went out (expenses) during that story, and whether you ended up with a profit or a loss.
A Balance Sheet, on the other hand, is a snapshot. It's a picture of your business's financial health on one specific day, showing what you own (assets), what you owe (liabilities), and the owner's stake (equity).
I always tell my clients to think of it this way: your P&L is like a video of your financial performance over the last month. The Balance Sheet is a single photo taken at midnight on the last day of that month.
Can I do my own P&L, or do I really need an accountant?
You can absolutely generate your own P&L, and modern accounting software makes the mechanics of it much easier than it used to be. The software does the heavy lifting of pulling the numbers together.
But the real value of an accountant isn't just in preparing the report; it's in the interpretation. An experienced eye can ensure everything is accurate and compliant, but more importantly, they can help you read between the lines. They’ll spot the opportunities you might have missed, point out the risks, and help you use those numbers to plan for tax more effectively and make smarter decisions for growth.
Getting to grips with your finances can feel overwhelming, but you don't have to figure it all out on your own. The team at Stewart Accounting Services can help you transform your P&L from a confusing report into a powerful tool that drives your business forward. We're here to give you more time, more money, and a clearer mind.
Find out how we can help by exploring our services at https://stewartaccounting.co.uk.