

To really get a handle on a company’s financial health, you’ve got to get comfortable with its three core financial reports. It's a bit like a doctor checking a patient's vitals—each report tells you something different, but you need all three for a complete diagnosis.
First, you have the income statement, which tells you if the business is actually making money over a set period. Then there's the balance sheet, a snapshot of what the company owns and owes on a single day. Finally, the cash flow statement tracks every pound coming in and going out. Nail these three, and you'll see the full picture.
Your Guide to the Three Core Financial Statements
Before digging into the numbers, it's crucial to understand the story they're telling. Financial statements aren’t just spreadsheets; they're the narrative of a company’s journey. Each one is a chapter, and you can only understand the plot by reading them together. Jumping straight to a single metric without this context is like reading the last page of a book first—you get an outcome, but you miss the whole story.
This guide is your starting point for understanding these essential documents. They don't exist in a vacuum; they're deeply interconnected. A profit on the income statement affects the company's value on the balance sheet, and the cash flow statement bridges the gap between the two.
The Three Pillars of Financial Reporting
At the centre of any financial analysis are three documents that every investor, owner, or manager needs to know inside out. Each one answers a different but equally vital question about the business.
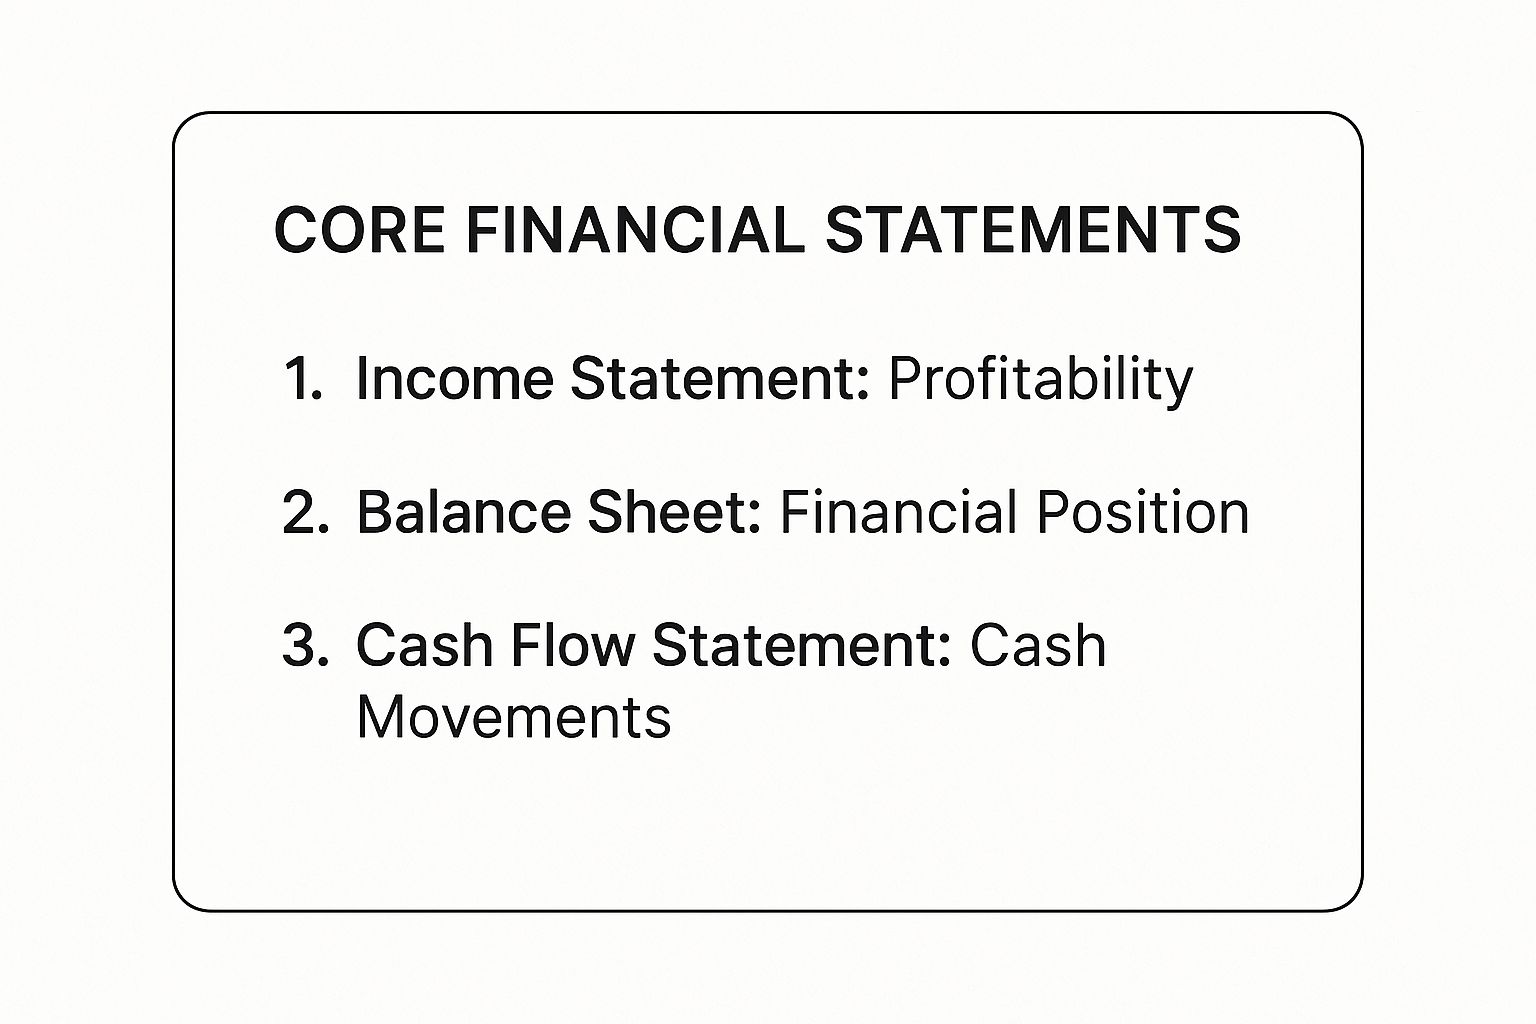
- The Income Statement: Often called the Profit and Loss (P&L) statement, this report shows a company's performance over a specific timeframe—be it a month, a quarter, or a full year. It directly answers the big question: "Is the business profitable?"
- The Balance Sheet: This gives you a snapshot of a company's financial standing at a single moment in time. It all boils down to a fundamental equation: Assets = Liabilities + Equity. In plain English, it tells you what a company owns and what it owes.
- The Cash Flow Statement: This one is all about the money trail. It tracks the actual cash moving in and out of the business. Profit is one thing, but cash is what keeps the lights on. This report answers the critical question: "Where did the cash come from, and where did it go?"
For a quick reference, here’s a simple table breaking down what each statement shows you.
The Three Core Financial Statements at a Glance
| Statement | What It Shows | Key Question It Answers |
|---|---|---|
| Income Statement | Profitability over a period (e.g., a quarter or year). | Is the company making money? |
| Balance Sheet | Financial position on a specific date. | What does the company own and owe? |
| Cash Flow Statement | The movement of cash over a period. | How is the company generating and using cash? |
Seeing them side-by-side like this helps clarify their distinct roles in telling the company's financial story.
This image helps to visualise how each statement offers a unique lens for viewing a company's health—profitability, position, and cash movements.
Realising how these documents connect is where the real insight begins.
The net income from the P&L flows into the equity section of the balance sheet, and the cash flow statement explains the change in the cash balance from one balance sheet to the next.
Grasping this interplay is crucial. It’s how you avoid common traps, like thinking a profitable company must be swimming in cash. I’ve seen plenty of businesses report healthy profits on paper but face a serious cash crunch because their clients are slow to pay.
For a deeper look into putting this all into practice, you might find learning how to read a financial report a helpful next step. Building this foundation makes every other part of your financial analysis far more intuitive.
Decoding Profit and Loss on the Income Statement
Often called the Profit and Loss (P&L) statement, the income statement gets straight to the point: did the business actually make any money? It's a financial summary of how your company performed over a set period, like a month, a quarter, or a full year.
Think of it as a story. It starts with your total sales right at the top, then methodically subtracts all the costs of doing business, and finishes with your ultimate profit at the very bottom. For anyone wanting to know how to read financial statements, the P&L is the perfect place to begin because it shows the direct results of your business strategy.
Starting at the Top: Revenue and Cost of Goods Sold
The journey down the P&L starts with Revenue, which you might also see called Sales or Turnover. This is your "top line" number—the total amount of cash generated from your goods or services before a single expense is taken out.
Immediately following revenue, you'll hit a crucial line item: the Cost of Goods Sold (COGS). This figure isn't just any expense; it represents the direct costs tied to producing what you sell.
If you run a retail business, for example, your COGS would include things like:
- The purchase price of the stock you sold.
- Direct labour costs for any in-house production.
- Raw materials used to create your products.
- Shipping costs to get the inventory to your warehouse.
It's vital to separate COGS from general operating expenses. COGS are variable costs you only incur when you actually sell something. No sales, no COGS.
Calculating Your Gross Profit
When you subtract COGS from your Revenue, you're left with your Gross Profit. This is a hugely insightful figure. It tells you exactly how much money you’ve made from sales alone, which is then available to cover all your other business expenses.
Gross Profit = Revenue – Cost of Goods Sold (COGS)
A healthy gross profit margin (calculated as Gross Profit divided by Revenue) is a great sign. It suggests you have solid pricing power and you're keeping your production costs in check. If you see that margin starting to shrink, it could be a red flag that raw material costs are creeping up or you're having to offer more discounts to stay competitive.
The Costs of Running the Business: Operating Expenses
Next up are the Operating Expenses (OpEx). Think of these as the essential costs of keeping the lights on and the doors open, regardless of your sales volume. They aren't directly linked to producing a specific item.
You’ll find familiar costs listed here:
- Salaries and wages for your admin, marketing, and sales teams.
- Rent for your office or shop.
- Utilities like electricity, water, and internet.
- Marketing and advertising campaigns.
- Professional fees for your accountant or legal advisor.
Subtracting these running costs from your Gross Profit gives you the Operating Profit, also known as Earnings Before Interest and Tax (EBIT). This number is a fantastic indicator of how profitable your core business operations are, before factoring in financing decisions and taxes. It’s a clean measure of pure operational efficiency.
To really dig into what these numbers mean, it helps to learn how to read earnings reports like an expert, as they often contain management's own commentary on these exact figures.
Reaching the Bottom Line: Net Income
We're now approaching the end of the P&L story. From your Operating Profit, there are just a couple more deductions to make.
- Interest Expense: This is the cost of borrowing money, such as interest payments on loans or lines of credit.
- Taxes: The corporation tax the company owes on its profits.
Once you’ve subtracted interest and taxes, you finally arrive at the famous "bottom line": Net Income. This is the ultimate measure of profitability. It’s the cash left over that can be reinvested into the business to fuel growth or be distributed to the owners as dividends.
Let's walk through a simplified example for a small retail shop over one year:
| P&L Line Item | Amount | Calculation |
|---|---|---|
| Revenue | £200,000 | Total sales |
| Cost of Goods Sold (COGS) | – £90,000 | Cost of stock sold |
| Gross Profit | £110,000 | £200,000 – £90,000 |
| Operating Expenses | – £60,000 | Rent, salaries, marketing |
| Operating Profit (EBIT) | £50,000 | £110,000 – £60,000 |
| Interest Expense | – £5,000 | Loan repayments |
| Profit Before Tax | £45,000 | £50,000 – £5,000 |
| Corporation Tax | – £9,000 | Tax on profits |
| Net Income | £36,000 | £45,000 – £9,000 |
This simple table clearly shows how a business with £200,000 in sales ultimately ended up with £36,000 in its pocket. Each step of the P&L peels back a layer of performance, from pricing strategy (Gross Profit) to day-to-day efficiency (Operating Profit) and, finally, its overall success (Net Income).
Understanding the Balance Sheet Snapshot

If the Income Statement is the movie of a company's year, the Balance Sheet is the high-resolution photograph. It captures a single, specific moment, showing you exactly what the business owns and what it owes on that particular day.
Everything on this statement hinges on one simple, yet powerful, principle that is the bedrock of all modern accounting.
It’s the core equation: Assets = Liabilities + Shareholder Equity.
Getting your head around this is non-negotiable if you truly want to know how to read financial statements. It tells you how everything the company owns (its assets) is paid for – either with borrowed money (liabilities) or with the owners' own funds (equity). Let's pull apart each piece.
What the Company Owns: Assets
Assets are simply all the resources a company controls that can provide future economic benefit. In other words, they’re all the things the business can use to make money. You'll usually see them listed in order of liquidity – how quickly they can be turned into cold, hard cash.
Assets are split into two main buckets:
- Current Assets: These are things the company expects to use up or convert to cash within one year. Think of cash in the bank, inventory on the shelves, and accounts receivable (the money customers owe them for recent purchases).
- Non-Current Assets: Often called fixed or long-term assets, these are the workhorses with a useful life of more than a year. This is where you’ll find property, plant, and equipment (PP&E), long-term investments, and intangible assets like patents or brand trademarks.
The mix of assets can tell a story in itself. A cutting-edge software company might look light on physical assets but be rich in intangible ones. A traditional manufacturer, on the other hand, will have a balance sheet heavy with factories and machinery.
What the Company Owes: Liabilities
Liabilities are the flip side of the coin – they represent a company's debts and obligations to others. It’s the money owed to suppliers, banks, and other creditors. Just like assets, liabilities are organised by when they need to be paid.
The breakdown is just as logical:
- Current Liabilities: These are debts that need to be settled within a year. Common examples include accounts payable (bills from suppliers), short-term loans, and accrued expenses like wages or taxes that are due but not yet paid.
- Non-Current Liabilities: These are the long-term obligations that aren't due for at least 12 months. This typically includes hefty bank loans, corporate bonds, and deferred tax liabilities.
A big red flag for me is when current liabilities start to creep up on current assets. It can signal that a company might face a cash crunch and struggle to pay its immediate bills – a crucial check for short-term stability.
The Owners' Stake: Shareholder Equity
After you take everything the company owns and subtract everything it owes, what's left is Shareholder Equity. This is the owners' slice of the pie – their residual claim on the company's assets. You’ll often hear this referred to as the "book value."
Shareholder Equity is the net worth of a company. It's the amount of money that would be returned to shareholders if all the assets were liquidated and all the company's debts were paid off.
Equity is built from two main sources:
- Share Capital: This is the original cash injection from investors when they first bought shares.
- Retained Earnings: This is the running total of all profits the company has ever made, minus any dividends it has paid out to shareholders. This figure creates a direct link back to the bottom line of the Income Statement.
A healthy, growing retained earnings balance is always a great sign. It shows that the company is not only profitable but is also reinvesting in itself to drive future growth.
It's also useful to view a company's balance sheet within the wider economic picture. For instance, the UK government's own financial health can shape the business environment. As of July 2025, the UK's public sector net financial liabilities were a staggering £2,525.3 billion, around 83.9% of GDP. This kind of macro-level debt provides a vital context when you’re assessing a company's own balance sheet resilience. You can find more detail on the UK's public finances on the Office for National Statistics website.
By analysing the interplay between assets, liabilities, and equity, you start to build a really clear picture of a company’s financial structure and its ability to thrive in the long run.
Following the Money with the Cash Flow Statement
Profit on paper is a great start, but it doesn't pay the bills. Cash does. This is where the Cash Flow Statement (CFS) becomes your most trusted guide, tracking the actual movement of money in and out of a business. It answers one simple but crucial question: where did the cash come from, and where did it go?
It’s a surprisingly common scenario for a business to look profitable on its income statement but still find itself unable to pay its suppliers. Understanding the cash flow statement explains how this happens. If you want to really know how to read financial statements, you have to learn how to follow the money, and the CFS is your map.
The statement is neatly organised into three core activities, giving you a clear picture of how cash is being generated and used across the entire business.
Cash from Operating Activities
This is the engine room. The Cash from Operating Activities (CFO) section shows you exactly how much cash a company generates from its core, day-to-day business. Think of it as the cash-based reality behind the income statement's net income figure.
It starts with Net Income and then adjusts for any revenues or expenses that didn't involve actual cash. For instance, depreciation is an expense that reduces profit, but no money physically leaves the business, so it gets added back here. It also accounts for changes in working capital – if customers are taking longer to pay their invoices (an increase in accounts receivable), that reduces your cash on hand, even if the sale has been officially recorded.
A consistently strong, positive cash flow from operations is the hallmark of a healthy, sustainable business. It means the core business model works and can fund itself without constantly needing outside help.
Cash from Investing Activities
Next up is Cash from Investing Activities (CFI). This part of the statement reveals how a company is spending money to build its future. It tracks cash used to buy long-term assets, or cash received from selling them.
You’ll typically see things like:
- Capital Expenditures (CapEx): Money spent on new property, machinery, or equipment – like buying a new delivery van or upgrading the office computers.
- Acquisitions: Cash used to buy another company or a significant business asset.
- Sale of Assets: Cash coming in from selling off old equipment or property.
Don't be immediately alarmed by a negative number here. In fact, negative cash flow in this section often means a company is investing in growth. A business spending heavily on new machinery is making a bet on future productivity. The real test is whether these investments start generating better returns and stronger operating cash flow down the line.
The level of business investment can also be a great barometer for wider economic confidence. For example, in the second quarter of 2025, UK business investment decreased by 4.0% compared to the first quarter, though it remained just 0.1% above the previous year's level. This sort of cautious trend suggests businesses might be holding back on major spending amid market uncertainties. You can find more details on UK business investment trends from the Office for National Statistics.
Cash from Financing Activities
Finally, Cash from Financing Activities (CFF) shows how a company raises money and pays it back. It details the flow of cash between the business, its owners, and its lenders.
The key activities you'll find here include:
- Issuing Stock: Cash flowing in from selling new shares to investors.
- Repaying Debt: Cash flowing out to pay down loans.
- Borrowing Money: Cash flowing in from taking out new loans.
- Paying Dividends: Cash paid out to reward shareholders.
This section offers a window into a company's financial strategy. Is it taking on more debt to fuel an expansion? Or is it confident enough in its own cash generation to start returning money to shareholders? A young, high-growth startup might show a big positive cash flow here as it raises funds, whereas a mature, stable business might be consistently negative as it repays debt and pays dividends.
When you put it all together, the net change from these three sections tells you whether the company’s cash pile grew or shrank during the period. This final number should perfectly explain the change in the cash balance you see on the Balance Sheet, tying all three financial statements together in one neat, logical loop.
Using Financial Ratios to Find Real Insights
The numbers on a financial statement? They're just the beginning. The real story begins when you start connecting those numbers. Think of financial ratios as your toolkit for turning raw data into genuine insight. They help you see past the surface-level figures and truly get to grips with a company's performance.
Ratios give you context, which is everything. They let you measure a company against its own history, its competitors, and the industry at large. This is how you stop just reading numbers and start making informed judgements. For anyone learning how to read financial statements, getting comfortable with a few key ratios is the natural next step.
Checking Short-Term Health with Liquidity Ratios
First up, liquidity. These ratios tell you whether a company can pay its bills in the short term. Can it cover suppliers, staff wages, and other immediate debts without having to flog its long-term assets?
The go-to metric here is the Current Ratio.
Current Ratio = Current Assets / Current Liabilities
A result of 2:1 is often held up as the gold standard, meaning you have £2 of current assets for every £1 of current liabilities. Drop below 1:1, and you might be looking at a red flag for future cash flow problems. But context is critical. A supermarket with fast-moving stock might operate perfectly fine on a lower ratio, whereas a heavy equipment manufacturer will likely need a much bigger cushion.
Gauging Efficiency with Profitability Ratios
Profitability ratios get to the heart of the matter: how good is a business at turning sales into actual profit? They cut through the vanity of big revenue figures and focus on what really counts. Two of the most important are the Net Profit Margin and Earnings Per Share.
- Net Profit Margin: This tells you what percentage of revenue is left after every single expense—including taxes and interest—has been paid. A 10% margin means the company banks 10p of profit for every £1 in sales. A consistently high margin points to efficient management and good pricing power.
- Earnings Per Share (EPS): For limited companies, this is a massive deal for shareholders. Knowing how to determine Earnings Per Share (EPS) is key to seeing how much profit is allocated to each outstanding share of stock.
These ratios become incredibly powerful when you track them over several years. A rising net profit margin? That’s a fantastic sign of improving efficiency or a strengthening market position.
Analysing these ratios isn't just an internal exercise. It’s also vital to consider the wider economic context, as external factors can significantly impact a company's stability and performance.
The UK's financial stability, for example, is reflected in its corporate and household debt levels. The Bank of England's recent Financial Stability Report highlighted that while UK banks have maintained profitability with price-to-book ratios now above 1, the outlook for household and corporate sectors is more cautious due to global trade uncertainties. Understanding these broader trends is vital for making sound financial decisions. Discover more insights on the UK financial stability report from the Bank of England.
Assessing Risk with Leverage Ratios
Finally, let's talk about risk. Leverage ratios measure how much a company is leaning on debt to fund its assets. Debt isn't inherently bad—it can be a powerful tool for growth—but too much of it can be a recipe for disaster.
The classic leverage ratio is the Debt-to-Equity Ratio.
Debt-to-Equity Ratio = Total Liabilities / Shareholder Equity
This simply compares the money put in by creditors to the money put in by owners. A high ratio (anything over 2:1 should make you look twice) suggests the company has been aggressive in using debt to grow. In a tough economy, that debt becomes a heavy weight, as interest payments don't stop just because profits do. A lower ratio usually points to a more conservative, and often safer, financial structure.
Answering Your Top Financial Statement Questions
As you start working with the big three statements, you'll inevitably run into some common sticking points. That’s perfectly normal. Getting from theory to real-world application always throws up a few questions. Let's walk through some of the things people ask me most often, so you can start reading these documents with a bit more confidence.
Think of this as your go-to guide for those "aha!" moments. These are the practical queries that come up time and time again when business owners first start digging into their own numbers.
"Which Financial Statement Is the Most Important?"
This is the classic question, and the honest-to-goodness answer is: it depends entirely on what you need to know. There’s no single "best" report because each one tells a crucial, yet different, part of your business's story.
- Looking for profitability? The Income Statement is your champion. It’s the clearest way to see if your day-to-day operations are actually making or losing money over a specific period.
- Worried about stability and long-term health? Head straight for the Balance Sheet. It’s a snapshot of your company's net worth and tells you if you have the assets to cover your debts.
- Need to know if you can pay the bills next month? The Cash Flow Statement is non-negotiable. It tracks the real cash moving in and out of the business, which is the ultimate test of survival.
Any seasoned analyst will tell you the real magic happens when you look at all three together. It's not uncommon for a company to look incredibly profitable on its income statement but be teetering on the edge of collapse because of poor cash flow—a critical issue that only the cash flow statement would flag.
"Why Isn't My Net Income the Same as My Cash Flow?"
Getting your head around this is probably the single most important step in understanding financial statements. Profit is an accounting concept; cash is what you use to pay your staff and suppliers. A business can be wildly profitable on paper and still go under because it runs out of cash.
So, where's the disconnect? It usually comes down to a few key things:
- Sales on Credit: You make a big sale and invoice a client. That revenue immediately shows up on your income statement, making your profit look great. But the cash isn't in your bank account until that invoice gets paid.
- Non-Cash Expenses: Your income statement includes expenses that don't actually involve cash changing hands, like depreciation. This accounting entry reduces your taxable profit, but no money has physically left your business.
- Big Asset Purchases: Buying a new piece of machinery is a massive cash outlay that hits your cash flow statement hard. On the income statement, however, that cost is spread out over many years as depreciation.
Grasping this difference is fundamental. It's the key to making sure a good month for profits doesn't blindside you with a cash crunch.
"What's the Deal with Accruals and Why Do They Matter?"
Most proper financial statements are prepared using the accrual method of accounting. The whole concept is built on one powerful principle: you should record revenue and expenses when they are earned or incurred, not just when the money moves.
Let's use an example. Say your business finishes a £5,000 project for a client in December, but they don't pay you until January. With accrual accounting, you recognise that £5,000 in revenue in December—because that’s when you did the work and earned the money.
This approach gives you a much truer picture of your company's performance in a given period. It does a better job of matching the costs you incurred with the revenue those costs helped to generate. It’s the very reason your income statement and cash flow statement can, and often do, tell two different but equally important stories.
Navigating these complexities is what turns raw data into smart decisions. At Stewart Accounting Services, we help business owners across the UK move beyond just reading the numbers to truly understanding what they mean for growth, profitability, and peace of mind. If you're ready to get clarity on your financial position and plan for a more profitable future, find out how we can help at https://stewartaccounting.co.uk.