
Think of a balance sheet as a financial snapshot. It’s a single, sharp picture that captures exactly what your business owns (assets) and what it owes (liabilities) on one specific day. It also shows how much the owners have invested in the business, known as equity.
What you’re left with is a clear, bottom-line figure for your company’s net worth at that moment in time.
A Snapshot of Your Business’s Financial Health

If your business finances were a film, your Profit and Loss statement would be the whole movie, showing your performance over a month or a year. The balance sheet, on the other hand, is a single, perfectly focused photograph taken on the last day of that period—say, the 31st of December.
This snapshot doesn’t tell you about sales or running costs. Instead, it reveals the cumulative result of every transaction your business has ever made. It answers the big, fundamental questions that every owner needs to ask:
- What resources do we actually have at our disposal?
- How much debt are we really carrying?
- On paper, what is this business truly worth?
Getting your head around this report is crucial. It’s one of the cornerstones of your financial reporting, sitting alongside your profit and loss statement and cash flow forecast. To see how they all fit together, it’s worth reading about the three most important financial reports.
The Foundational Accounting Equation
At the heart of every balance sheet is a simple but powerful rule: the accounting equation. This formula is the reason it’s called a ‘balance’ sheet—it has to balance, every single time.
Assets = Liabilities + Equity
In plain English, this means everything the company owns (its assets) was paid for in one of two ways: either by borrowing money (liabilities) or with funds invested by its owners (equity). So, if your business has £100,000 worth of assets, that £100,000 had to come from somewhere. It’s a fundamental check that underpins the integrity of your financial records.
To make this clearer, let’s break down the three core components. These are the pillars that hold up your entire balance sheet.
The Three Pillars of Your Balance Sheet
| Component | Simple Definition | Examples for a UK SME |
|---|---|---|
| Assets | Things of value your business owns that can provide future economic benefit. | Cash in the bank, invoices owed to you (debtors), machinery, company vehicles, office property. |
| Liabilities | What your business owes to other people or organisations. | Bank loans, money owed to suppliers (creditors), VAT or Corporation Tax liabilities. |
| Equity | The value left in the business after you’ve paid off all your debts. | Share capital (the initial investment), retained earnings (profits reinvested in the company). |
Essentially, you list everything you own, subtract everything you owe, and the result is the owners’ stake in the company.
Why This Matters for UK SMEs
If you run a limited company here in Central Scotland—whether you’re in Alloa or Falkirk—the balance sheet isn’t just a useful tool. It’s a legal requirement for your annual filings with Companies House and HMRC.
On a larger scale, these individual business snapshots combine to paint a picture of the UK’s economic health. According to the Office for National Statistics (ONS), the UK’s national net worth climbed by a staggering £1.0 trillion in 2021 alone, largely driven by increases in the value of assets held by businesses and households.
To get a practical feel for how this works for your own company, using a professional financial statements template can make a world of difference. Seeing these components laid out clearly is the first step to truly understanding your business’s financial position.
Getting to Grips with Assets, Liabilities, and Equity
To really understand your business’s financial position, you need to look past the top-line number and dig into the three pillars of the balance sheet: Assets, Liabilities, and Equity. These aren’t just dry accounting terms; they’re the core components that tell the story of what your company has, what it owes, and what it’s ultimately worth.
Let’s break them down one by one, using real-world examples you’d see in your own operations.
What Your Business Owns: Assets
Simply put, assets are all the resources your business owns that have value. Think of them as everything you can use to make money or that could be turned into cash down the line. To make sense of them, we split assets into two main groups: current and non-current. This little distinction is a big deal because it helps you quickly see how much liquidity you have – that is, your ability to cover your short-term bills.
Current Assets are the resources you expect to use up or convert into cash within a year. They’re the lifeblood of your day-to-day business.
- Cash and Equivalents: This is the most straightforward – it’s the money sitting in your business bank accounts.
- Accounts Receivable (Debtors): This is the cash you’re waiting on from customers. You’ve done the work or sold the goods, but the invoice hasn’t been paid yet.
- Inventory: If you run a retail shop, this is the stock on your shelves. For a builder, it could be your supply of timber and bricks.
Non-Current Assets are your long-term investments. You don’t expect to turn these into cash within the next twelve months; instead, they’re the foundational tools that help your business operate year after year.
- Property, Plant, and Equipment (PP&E): This covers the big-ticket items like your office building, company vehicles, machinery, and computers. Remember, most of these assets depreciate, meaning their value on paper goes down over time.
- Intangible Assets: These are valuable things you can’t physically touch, such as patents, trademarks, or the goodwill you’ve built up in your brand.
For a local builder in Stirling, their assets would include cash in the bank, outstanding invoices for completed jobs (debtors), their van, and expensive tools like cement mixers. Each one is a resource that helps them operate and bring in revenue.
What Your Business Owes: Liabilities
Liabilities are your company’s debts—the money you owe to other people or businesses. Just like assets, we split them into current and non-current. This helps you understand the financial pressure you’re facing, both immediately and further down the road.
Getting a clear picture of your liabilities means no nasty surprises. It shows you exactly what you need to pay and when, which is absolutely fundamental for good cash flow management.
Current Liabilities are debts you need to settle within one year. Keeping on top of these is vital for your business’s health.
- Accounts Payable (Creditors): This is the money you owe your suppliers for materials or services they’ve provided to you.
- Short-Term Loans: Think of your business overdraft or the portion of a larger loan that’s due for repayment in the next 12 months.
- Accrued Expenses: These are costs you’ve racked up but haven’t been billed for yet, like employee wages for the current month.
- Tax Liabilities: This includes things like VAT, PAYE, and Corporation Tax that you owe but haven’t yet paid over to HMRC.
Non-Current Liabilities are your long-term financial commitments that fall due after one year.
- Long-Term Loans: This covers business loans or mortgages with a repayment schedule that stretches out beyond the next 12 months.
- Deferred Tax Liabilities: This is a more complex one, but it’s essentially tax that is owed but won’t be paid until a future date.
Imagine a small Falkirk-based retail shop. Its liabilities would include the bill from its wholesale clothing supplier (creditors), the upcoming quarterly VAT payment, and the long-term bank loan it took out to get the shop started.
What Your Business is Worth: Equity
Equity is the bottom line. Sometimes called ‘shareholders’ equity’ or ‘owner’s equity’, it represents the net worth of your business. You calculate it by taking your total assets and subtracting your total liabilities. It’s what would be left over for the owners if you sold everything and paid off every single debt.
Equity is the ultimate measure of the owners’ stake in the company.
- Share Capital: This is the money the owners first put into the business in exchange for shares. For a sole trader, this is often just called ‘owner’s capital’.
- Retained Earnings: This is the running total of all the profits your business has made over the years that you’ve ploughed back into the company instead of taking out as dividends. Healthy retained earnings are a fantastic sign of a growing, financially sound business.
A positive and growing equity figure shows your business is building real value. On the flip side, if your liabilities are greater than your assets, you have negative equity – a serious red flag that your business is in financial trouble. By truly understanding these three elements, your balance sheet stops being a confusing page of numbers and becomes a powerful, at-a-glance summary of your financial reality.
How to Read a Balance Sheet with Confidence
Staring at a balance sheet for the first time can feel like trying to decipher a foreign language. It’s a wall of numbers and labels that, on their own, don’t seem to say much at all. But once you get the hang of the structure, that confusing list of figures transforms into a clear, compelling story about your business’s financial health.
The trick is to stop seeing it as a maths test and start seeing it as a narrative. Every line is connected, and a change in one place will always cause a ripple effect somewhere else. Why? To keep that fundamental accounting equation—Assets = Liabilities + Equity—in perfect harmony.
Let’s walk through how to read a balance sheet, line by line, so you can start using it as the powerful tool it is.
This diagram shows the simple, visual relationship between the three core components.
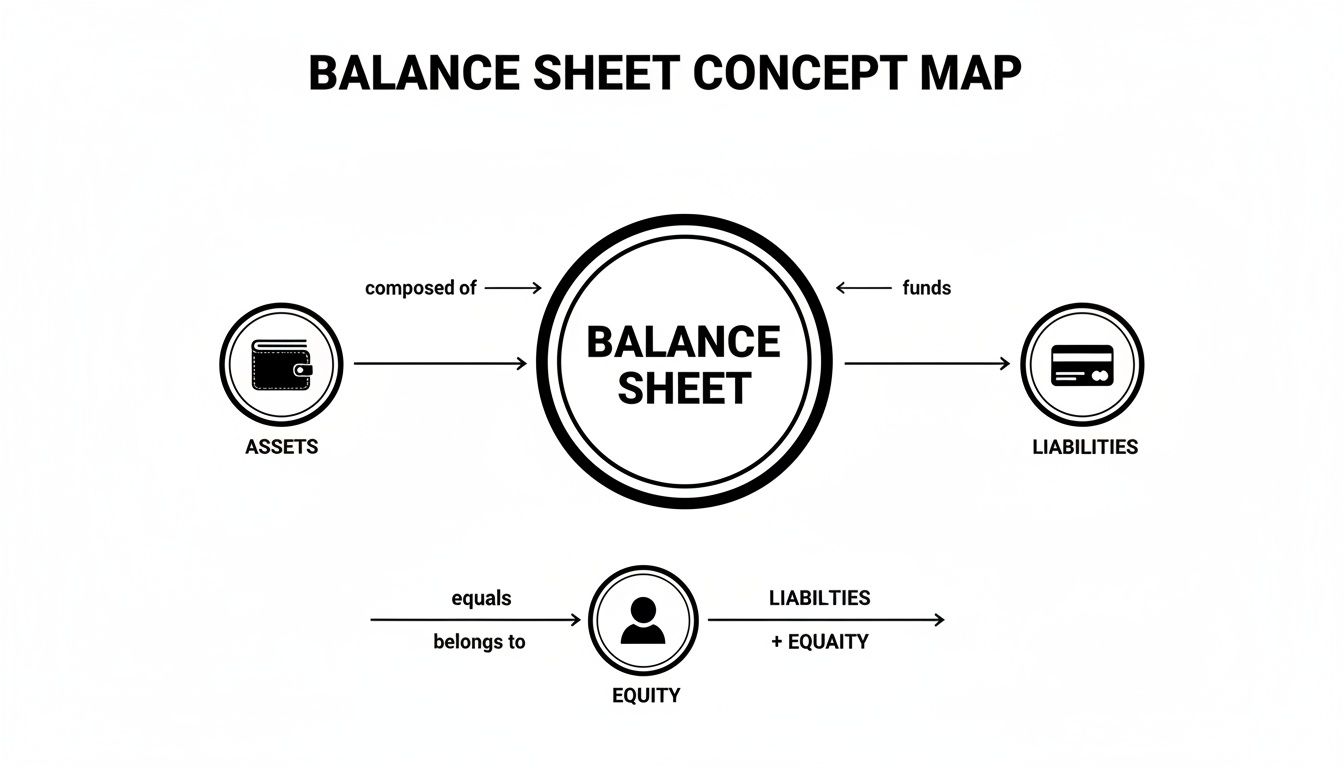
It’s a great illustration of how everything your business owns (Assets) is funded by either what it owes to others (Liabilities) or what the owners have put in (Equity). The two sides must always, always match.
A Step-by-Step Walkthrough
Let’s break down a sample balance sheet for a fictional UK company, “Falkirk Furnishings Ltd.” This is the kind of report you’d get from accounting software like Xero. We’ll start at the top and work our way down, demystifying each part as we go.
1. First Thing’s First: Check the Date
Before you look at a single number, find the date. It will say something like, “As at 31st December 2024”. This is critical. Unlike a profit and loss report, which covers a period of time (like a month or a year), a balance sheet is a snapshot. It shows your company’s financial position frozen in time on that one specific day.
2. Sizing Up Your Assets
Next, look at the Assets section. This is usually split into two categories: non-current and current. Your first move is to add these two totals together to find your Total Assets. This number represents the combined value of everything your company owns.
- Non-Current Assets: Think of these as the long-term workhorses of your business. For Falkirk Furnishings, this could be a delivery van (£15,000) and workshop machinery (£20,000). They’re not for sale; they’re here to help the business operate for years.
- Current Assets: These are resources you expect to convert into cash within a year. It includes cash in the bank (£10,000), inventory of wood and fabric (£5,000), and invoices your customers haven’t paid yet (debtors) (£3,000).
Add them all up, and Falkirk Furnishings has £53,000 in Total Assets.
3. Taking Stock of Your Liabilities
Now, shift your focus to the liabilities—what the business owes. Just like assets, this part is divided into current and non-current. Add them together to get your Total Liabilities.
- Current Liabilities: These are your short-term debts, due within the next 12 months. This might be an invoice from a timber supplier (£4,000) or a VAT bill that needs paying to HMRC (£2,000).
- Non-Current Liabilities: This is for long-term borrowing. A classic example is the outstanding balance on a five-year bank loan used to buy that van, say £8,000.
For Falkirk Furnishings, the Total Liabilities come to £14,000.
Bringing It All Together
The final, and most satisfying, step is to calculate the Net Assets. This is the true measure of your company’s value on paper. It’s what would be left if you sold off all your assets and paid off all your debts.
Net Assets = Total Assets – Total Liabilities
For our example: £53,000 (Total Assets) – £14,000 (Total Liabilities) = £39,000 (Net Assets).
This Net Assets figure is the magic number. It must always equal the final section on your balance sheet: Equity (sometimes called ‘Shareholders’ Funds’). The Equity section explains how those net assets are funded from the owners’ side. It might include:
- Share Capital: The initial £100 the owner invested to get the company off the ground.
- Retained Earnings: £38,900 in profits from previous years that have been kept in the business to fund growth.
When you add them together (£100 + £38,900), the Total Equity is £39,000. It perfectly matches the Net Assets figure, and voilà—the sheet is balanced.
By following this simple top-to-bottom process, you can cut through the jargon and see the real story your numbers are telling. To take your understanding even further, check out our complete guide on how to read financial statements for more insights.
Using Your Balance Sheet for Smarter Decisions
Your balance sheet is far more than a document you dust off once a year for HMRC. Think of it as a strategic roadmap, packed with insights that can help you make smarter, more confident business decisions. Once you get the hang of reading it, you’ll be able to steer your company’s growth, not just react to its financial position.
This report holds the answers to some of the most critical questions you face as a business owner. Can we really afford to hire that new team member? Is our current debt level sustainable, or are we overstretched? How can we get ahead of cash flow issues before they become a real problem? The trick is learning to translate the numbers into actionable intelligence.
A powerful way to do this is by calculating a few key financial ratios. These are simple formulas that turn the raw data from your balance sheet into meaningful metrics, giving you a quick and clear health check on different areas of your business.
Measuring Your Short-Term Financial Health
One of the most immediate concerns for any business owner is liquidity—your ability to pay your short-term bills as they come due. It’s a harsh reality that even a profitable business can go under if it runs out of cash. Luckily, your balance sheet is the perfect tool for keeping your finger on this pulse.
The Current Ratio is your go-to metric here. It directly compares what you own that’s easily converted to cash (current assets) with what you owe in the near future (current liabilities).
- Formula: Current Assets / Current Liabilities = Current Ratio
- What it tells you: This ratio shows how many pounds of current assets you have for every pound of current liabilities. A ratio of 2:1 is often seen as a healthy benchmark, suggesting you have twice the liquid resources needed to cover your immediate debts.
- Interpretation: If your ratio dips below 1:1, it’s a warning sign. It means you don’t have enough liquid assets to meet your short-term obligations, which could quickly lead to serious cash flow problems.
This simple calculation is a cornerstone of managing your company’s financial stability. For a deeper dive into this concept, you can learn more about what is working capital and how it impacts your daily operations.
Assessing Your Long-Term Stability
Beyond day-to-day survival, your balance sheet reveals your business’s long-term sustainability and risk profile. Lenders and potential investors pay very close attention to this, and so should you. It helps you decide whether taking on more debt to fund that big expansion is a wise move or a dangerous gamble.
The Debt-to-Equity Ratio is the key indicator for this. It measures how much of your business is financed by borrowing compared to how much is funded by the owners’ investment.
Debt-to-Equity Ratio = Total Liabilities / Total Equity
A high ratio suggests the company relies heavily on borrowing, which can be risky, especially if interest rates rise or sales dip unexpectedly. On the other hand, a low ratio indicates a more conservative financial structure with less risk. There’s no single “perfect” number; what’s considered normal varies hugely by industry. As a specific example, understanding service charge accounting in property management shows just how critical managing liabilities and equity is in that sector.
Key Balance Sheet Ratios for Business Owners
To help you get started, here’s a quick-reference table with some of the most useful ratios you can pull from your balance sheet.
| Ratio Name | Formula | What It Tells You |
|---|---|---|
| Current Ratio | Current Assets / Current Liabilities | Your ability to cover short-term debts. A healthy sign is typically around 2:1. |
| Quick Ratio (Acid-Test) | (Current Assets – Inventory) / Current Liabilities | A stricter test of liquidity, showing if you can pay bills without selling stock. Aim for over 1:1. |
| Debt-to-Equity Ratio | Total Liabilities / Total Equity | How much of your business is financed by debt versus owner’s capital. High ratios can signal risk. |
| Debt-to-Asset Ratio | Total Liabilities / Total Assets | What percentage of your assets is financed through debt. A lower percentage is generally safer. |
| Working Capital | Current Assets – Current Liabilities | The actual cash available for day-to-day operations. A positive number is essential. |
Looking at these ratios regularly will transform your balance sheet from a historical document into a powerful, forward-looking tool for making much better business decisions.
Common Balance Sheet Mistakes to Avoid
A tiny error on your balance sheet can paint a completely misleading picture of your company’s financial health. This can lead you to make poor decisions or, worse, land you in hot water with HMRC. While modern accounting software is a huge help, knowing the common tripwires is the best way to keep your numbers clean and reliable.
So many mistakes come down to simple misclassification. A classic example is recording a five-year bank loan entirely as a current liability. Doing this will torpedo your current ratio, making your business look like it’s on the brink of a cash flow crisis when it isn’t. The right way is to split it: the portion due in the next 12 months is a current liability, and the rest sits under non-current liabilities.
Another one we see all the time is forgetting to account for depreciation. That van you bought three years ago isn’t worth what you paid for it. If you don’t record that gradual loss in value, you’re overstating your assets and, by extension, your company’s net worth.
Inventory and Director’s Loans
If your business holds stock, you need to be careful with inventory valuation. Whether it’s using the wrong costing method or failing to write off that box of obsolete widgets in the back of the warehouse, the result is the same: an inflated asset value. It can give you a false, and dangerous, sense of security.
For owners of UK limited companies, the director’s loan account is a particularly hazardous area. Any money you take out of the business that isn’t a salary or a dividend is technically a loan from the company to you. Get this wrong, and you could face some serious tax consequences, both personally and for the business, if it isn’t handled correctly by your year-end.
These aren’t just academic exercises; they have real-world consequences that warp the story your balance sheet is trying to tell you.
An accurate balance sheet is fundamental for any UK business, from a sole trader tracking assets to a large partnership managing complex liabilities. Even national entities are scrutinised this way.
Just look at the Bank of England’s balance sheet. It averaged 343,078 GBP million between 2006 and 2025, but swelled to a staggering all-time high of 1,119,387 GBP million in December 2021. That massive expansion, over 14 times its 2007 low, directly impacts borrowing costs and asset values for every single business in the country. You can dig into these trends on the Trading Economics website.
Preventing Common Errors
The best defence here is a good offence, which means combining good habits with the right tools. There’s simply no substitute for consistent, organised bookkeeping.
Here are a few practical steps you can take:
- Reconcile Regularly: Get into the habit of matching your bank statements to your accounting records every month. It’s the easiest way to catch small discrepancies before they grow into monsters.
- Understand Classifications: Take a moment to really get your head around the difference between current and non-current. It’s the key to making sure your financial ratios are telling you the truth.
- Automate Where Possible: Let accounting software like Xero do the heavy lifting. Automating things like depreciation calculations and bank feeds dramatically cuts down on human error.
By sidestepping these common mistakes, you can be sure the financial snapshot you’re looking at is a true reflection of reality. And that’s what allows you to make decisions with genuine confidence.
Got Questions About Your Balance Sheet? We’ve Got Answers
Once you get your head around the basics, a few practical questions almost always pop up. Let’s tackle the ones we hear most from business owners in the UK, with some straightforward, no-nonsense answers.
How Often Should I Be Looking at My Balance Sheet?
Officially, you only need to prepare one for your year-end accounts. But if that’s the only time you look at it, you’re missing a trick.
Think of it as a health check for your business. A monthly or quarterly review is a fantastic habit to get into. It turns your balance sheet from a simple compliance task into a genuinely useful tool for making smart decisions. Regular check-ins let you spot trends early. Are your debts slowly creeping up? Are your customers starting to take longer to pay you? Catching these things early gives you a chance to fix them before they snowball into bigger problems.
What’s the Difference Between a Balance Sheet and a P&L?
This is easily the most common point of confusion, but there’s a simple way to think about it.
Imagine your business finances are a film. Your Profit & Loss (P&L) statement is the whole story, showing all the action—your sales and costs—over a period, like a month or a year. The balance sheet? That’s just a single, sharp snapshot taken at a specific moment in time.
The P&L tells you whether you made a profit by tracking your income against your expenses. The balance sheet, on the other hand, doesn’t care about profit. It simply shows you the company’s financial standing—everything it owns and everything it owes—on one particular day. You really need both to see the full picture.
Can a Business Have Negative Equity?
Yes, it can, and it’s a serious red flag you can’t afford to ignore. Negative equity happens when a company’s total liabilities are greater than its total assets. In plain English, it means that even if you sold off every single thing the business owns, you still wouldn’t have enough cash to pay off all its debts.
This is a state of technical insolvency. For directors of a limited company, this is critical information that can impact your ability to keep trading. If you see this on your balance sheet, it’s a sign you need to take immediate action, whether that’s injecting fresh capital or fundamentally restructuring your finances.
Why Is My Bank Balance So Different From My Profit?
This is a classic headache for business owners. You look at your P&L, see a healthy profit, and feel great. Then you look at your bank account, and it’s nearly empty. What gives? The answer is almost always hiding on your balance sheet.
Profit is an accounting figure, but cash is what you use to pay the bills. They aren’t the same thing, and plenty of business activities hit your cash without ever touching your profit.
Here are a few common examples:
- Paying down a loan: Making a loan repayment reduces your cash (an asset) and your loan balance (a liability). Your P&L isn’t involved at all.
- Buying new equipment: If you buy a new van for the business, you’re just swapping one asset (cash) for another (the vehicle). Again, no impact on profit.
- Waiting for customers to pay: Your P&L records a sale as soon as you send the invoice. But the cash doesn’t actually hit your bank account until the customer pays up.
Getting to grips with these differences is the secret to properly managing your cash flow and avoiding any nasty surprises.
Ready to stop seeing your balance sheet as a chore and start using it as a strategic tool for growth? The team at Stewart Accounting Services can get you set up with clear, simple reporting in Xero, help you understand what the numbers are really saying, and give you the expert advice you need to steer your business with confidence. Get in touch with us today and let’s bring some clarity to your finances.