

Think of your chart of accounts as the financial filing cabinet for your entire business. It’s a complete, organised list of every single account in your general ledger, giving every transaction a proper home. This isn't just about bookkeeping; it’s the very foundation of your financial reporting.
Your Financial Blueprint: What Is a Chart of Accounts?

Imagine your business finances are a sprawling story, full of twists, turns, and different characters. Your Chart of Accounts (CoA) is the index that helps you follow the plot. It’s more than just a list—it's the system that brings order to the chaos, categorising every pound that comes in and goes out.
Without a CoA, your financial data is just a jumble of random numbers. With it, every sale, every invoice, and every payment is sorted logically. This structure is the central nervous system of your business finances, turning day-to-day transactions into reports you can actually understand and use.
The Bedrock of Your Financial Reports
For any UK business, a well-organised CoA is non-negotiable. It’s the framework that underpins crucial financial statements like your Profit and Loss report and your Balance Sheet. These aren't just for your accountant; they're essential for making smart business decisions, applying for loans, and staying on the right side of HMRC.
A thoughtfully designed chart of accounts is the first step toward financial clarity. It separates signal from noise, allowing you to see exactly where your money is coming from and where it is going. This visibility is crucial for sustainable growth.
The practice is common for a reason. In the UK, around 85% of medium to large enterprises use a customised chart of accounts in their accounting software, whether it's Xero or QuickBooks. It's a fundamental part of accurate financial management and regulatory compliance.
To build a solid financial blueprint, many businesses explore professional financial data solutions to get their systems in order. A well-structured CoA is always the starting point, providing the architecture needed for any meaningful financial analysis.
The Five Core Account Types at a Glance
Before diving deeper, it helps to understand the five fundamental pillars that form the basis of any chart of accounts. Getting to grips with these is the first real step to mastering your business's financial story.
| Account Type | What It Represents | Example for a UK Business |
|---|---|---|
| Assets | Resources your business owns that have value. | Cash in your business bank account, office equipment. |
| Liabilities | What your business owes to others. | A business loan, outstanding supplier invoices (Accounts Payable). |
| Equity | The net worth of the business (Assets – Liabilities). | Owner's capital investment, retained earnings. |
| Revenue | Money earned from your business activities. | Sales of goods or services, client fees. |
| Expenses | Costs incurred to run the business. | Rent for your office space, employee salaries, software subscriptions. |
These five categories are the building blocks. Every transaction your business makes will ultimately fall into one of them, helping to build a clear and accurate picture of your financial health.
Deconstructing the Core Account Types
Think of your chart of accounts as the financial version of a well-organised library. Every book has its place on a shelf, and each shelf is in a clearly marked section. This simple, logical structure is exactly what the five core account types bring to your business finances, making sure every transaction gets filed in the right spot.
These five pillars—Assets, Liabilities, Equity, Revenue, and Expenses—are the fundamental sections of your financial library. They aren’t just for tidy bookkeeping; they’re the building blocks for the two most important financial stories your business will ever tell: the balance sheet and the income statement.
The Balance Sheet Accounts
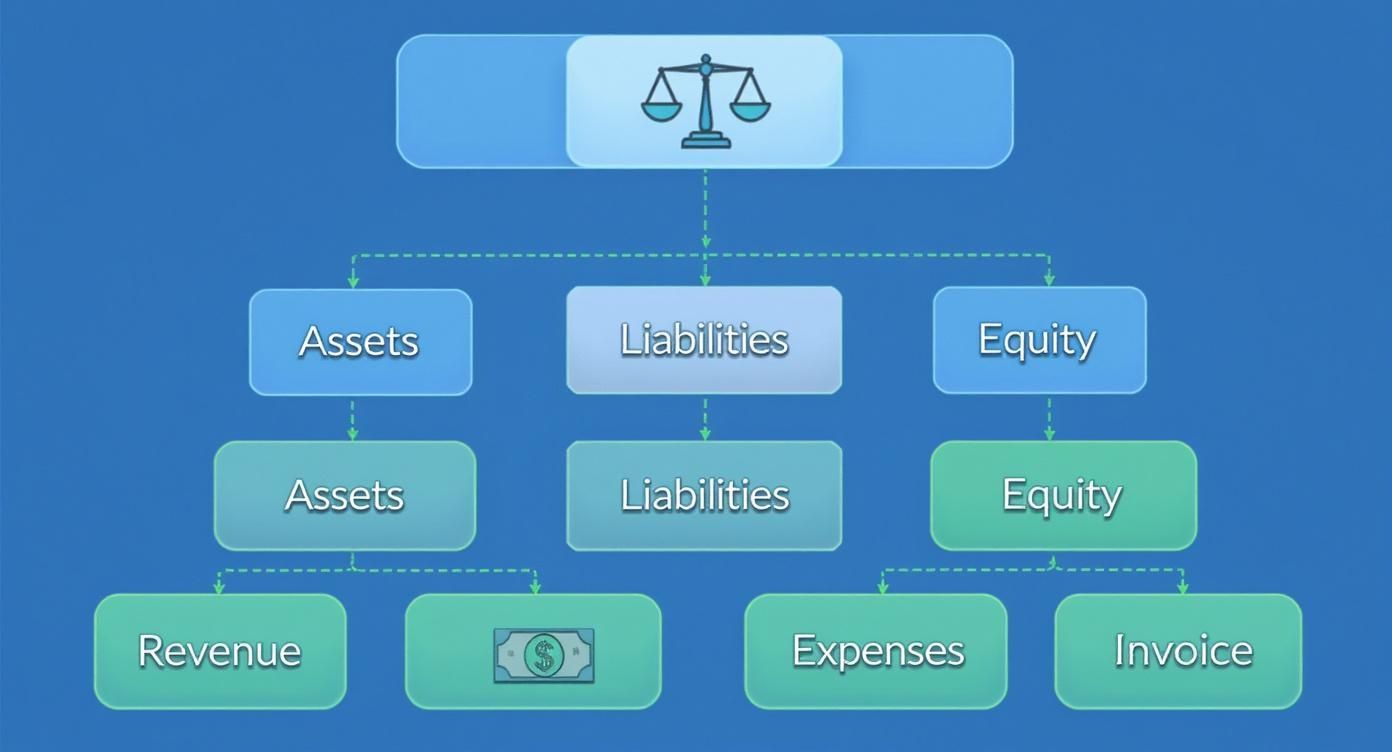
The first trio—Assets, Liabilities, and Equity—are what we call balance sheet accounts. Together, they offer a snapshot of your company's financial health at a specific moment in time. Their relationship is defined by a simple but powerful formula: Assets = Liabilities + Equity. As the name suggests, this equation must always balance.
Let's break them down.
-
Assets: What Your Business Owns
These are the resources your company controls that hold future value. It’s everything that helps you operate and make money, from the cash in your bank account to the laptop on your desk. We usually split assets into current (things you expect to use or convert to cash within a year) and non-current (long-term) items. -
Liabilities: What Your Business Owes
This is the other side of the coin, representing your financial obligations to others. Liabilities are the debts your business needs to settle, like a bank loan, an outstanding credit card balance, or payments due to your suppliers. -
Equity: The Net Worth of Your Business
Quite simply, equity is what’s left when you subtract your total liabilities from your total assets. It’s the owner's stake in the company, made up of initial investments and any profits that have been ploughed back into the business over the years.
A clear separation between these three account types is the bedrock of financial stability. It tells you, investors, and lenders exactly what you have, what you owe, and what your business is ultimately worth.
Getting a handle on this structure is vital for understanding your company's solvency. In fact, seeing how these elements fit together is key to understanding accounting basics like the profit and loss and balance sheet reports.
The Income Statement Accounts
The final two account types—Revenue and Expenses—tell a completely different story. Known as income statement accounts (or Profit & Loss accounts), they track your company's financial performance over a period of time, like a month, a quarter, or a full year.
They reveal how profitable you've been by pitting all the money coming in against all the money going out. This doesn’t just tell you if you made a profit, but how you made it.
-
Revenue: The Money You Earn
This is the income your business brings in from its day-to-day operations, whether that’s selling products or delivering services. It's the top line on your income statement and shows how successful you are at generating sales. You might have accounts like "Consulting Fees," "Product Sales," or "Subscription Income." -
Expenses: The Costs of Doing Business
These are all the costs you rack up to generate your revenue. Every pound spent on rent, salaries, marketing, and software slots into this category. Keeping a close eye on expenses is absolutely essential for managing cash flow, spotting potential savings, and calculating your taxable profit.
When combined, these five account types give you a complete, multi-dimensional view of your business. The balance sheet paints a picture of your financial foundation, while the income statement tracks your performance. A well-designed chart of accounts makes sure both stories are told with total accuracy.
Designing Your Chart of Accounts Numbering System
Once you’ve got your head around the five main account types, the next job is to arrange them into a structure that makes sense at a glance. A smart numbering system is the secret to a chart of accounts that’s not just organised, but intuitive and ready to grow with you. It turns a simple list of accounts into a powerful, easy-to-read map of your finances.
Think of it like a library’s filing system. Each book has a unique code that tells you its genre, section, and exact place on the shelf. In the same way, an account number should instantly tell you what kind of transaction you’re looking at. This simple logic makes bookkeeping faster, reduces the risk of expensive mistakes, and creates a system that can handle more complexity as your business expands.
The Logic Behind Number Ranges
The most common and effective way to do this is to assign a block of numbers to each of the five core account types. There’s no single, legally required system, but a standard structure gives you a clear hierarchy that works seamlessly with most accounting software, like Xero or QuickBooks.
This structure is all about separating your Balance Sheet accounts (what you own, what you owe, and what’s left) from your Income Statement accounts (what you’ve earned and what you’ve spent).
This fundamental split is the foundation of your numbering system, helping you identify an account's purpose just by looking at its code.
A typical numbering scheme looks something like this:
- 1000s – Assets: Accounts starting with a '1' represent everything your business owns.
- 2000s – Liabilities: Numbers beginning with a '2' are for everything your business owes.
- 3000s – Equity: The '3' range is for the owner's stake and retained earnings in the business.
- 4000s – Revenue: Accounts starting with '4' track all the income you bring in.
- 5000s – Expenses: The '5' block covers all the costs of doing business.
Within each range, you can get more specific. For example, 1010 might be your main current account, while 1200 could be for your stock (inventory). This approach builds in consistency from day one and leaves you plenty of room to add new accounts later without messing up the whole system.
A logical numbering system isn't just a neat-and-tidy exercise; it's a genuine productivity hack. It cuts down on manual errors, speeds up bookkeeping, and makes financial reports far easier for both you and your accountant to understand.
A Practical Example for a UK Business
Let's bring this to life with an example. Imagine a small UK-based e-commerce store. This business needs to track things like inventory, online sales, shipping costs, and software subscriptions. A well-structured chart of accounts gives every single one of these transactions a proper home.
The table below shows what a basic chart of accounts might look like for this kind of business. It’s a great starting point you can adapt to fit the unique needs of your own company.
Sample Chart of Accounts for a UK E-commerce Store
| Account Number | Account Name | Account Type | Description |
|---|---|---|---|
| 1010 | Business Current Account | Asset | Main bank account for daily operations. |
| 1200 | Inventory Asset | Asset | Value of stock available for sale. |
| 2010 | Business Credit Card | Liability | Balance owed on the company credit card. |
| 2300 | VAT Payable | Liability | VAT collected from sales, due to HMRC. |
| 3000 | Owner's Capital | Equity | Initial funds invested into the business. |
| 4010 | Online Product Sales | Revenue | Income generated from e-commerce sales. |
| 5010 | Cost of Goods Sold | Expense | Direct costs of the products sold (stock cost). |
| 5110 | Website Hosting Fees | Expense | Annual cost for website and e-commerce platform. |
| 5120 | Digital Advertising | Expense | Costs for online marketing campaigns. |
| 5200 | Salaries and Wages | Expense | Payments to employees. |
As you can see, the numbers immediately tell a story—4010 is clearly income, while 5120 is just as clearly a cost. This logical flow is what makes a chart of accounts such a powerful tool for any business owner.
Getting Your Chart of Accounts Set Up in Xero and QuickBooks
Right, you’ve got the theory down. Now, let’s get practical. When you first fire up cloud accounting software like Xero or QuickBooks, you'll find a default chart of accounts already waiting for you. Think of it as a generic, off-the-shelf suit – it’s a decent starting point, but it won’t fit your business perfectly.
The real magic happens when you tailor this template to reflect how your business actually operates. A customised CoA isn't just a "nice-to-have"; it’s what turns your accounting software from a digital shoebox for receipts into a sharp, insightful business tool.
This means you’ll be doing three things: adding new accounts that are specific to your business, editing the names of existing ones to make them clearer, and archiving the default accounts you’ll never use. A little bit of effort here at the beginning will save you a world of pain and re-categorisation work later on.
Your First Steps in Xero
Getting this done in Xero is refreshingly straightforward. You don't need to be an accountant to get to grips with it.
- Find the Chart of Accounts: From the main dashboard, head to the Accounting menu and click on Chart of Accounts. This brings up the full default list Xero has set up for you.
- Add a New Account: Hit the Add Account button. A simple form will pop up asking for the Account Type (e.g., Expense, Revenue), a unique Code, a descriptive Name, and the correct Tax rate.
- Edit an Existing Account: If you want to tweak an account, just click on its name in the list. You can easily change the name, description, or tax rate to make more sense for your business.
- Archive Unused Accounts: See an account that's completely irrelevant? Tick the checkbox next to it and click Archive. This hides it from your day-to-day view, keeping things tidy, but doesn't delete it forever in case it was used in the past.
This screenshot shows just how simple adding a new account is in Xero. It’s this control panel that lets you mould your chart of accounts into a perfect mirror of your business.
Customising Your QuickBooks Setup
The story is much the same over in QuickBooks. The interface looks different, but the core idea of customisation is identical – it’s all about making sure your financial data is organised properly from the get-go.
You'll start by finding the Chart of Accounts, which is usually under the Accounting or Bookkeeping menu. From there, you have the same options to add new accounts, edit the existing ones for clarity, or make irrelevant ones inactive.
For instance, a digital marketing agency would get far more insight by adding specific expense accounts like "Client Software Subscriptions" or "Freelance Content Writers" instead of lumping everything into a vague "Contractors" category.
Tailoring your chart of accounts is the difference between having a vague financial overview and having a detailed operational map. It allows you to track profitability by service line, identify your biggest cost centres, and make truly data-driven decisions.
Trying to pick a platform can be tricky, as they both have their pros and cons. If you're weighing up your options, taking a look at a detailed comparison of Xero vs QuickBooks for UK businesses can be a massive help. Both are excellent tools, but one will likely be a better fit for your specific needs.
Ultimately, whichever software you land on, the mission remains the same: build a financial framework that speaks your business’s unique language. A well-crafted CoA ensures every report you pull isn't just accurate but is packed with insights you can actually use to steer your company forward.
Common Mistakes and Best Practices for Maintenance

Getting your chart of accounts set up is a massive step forward, but the real work lies in keeping it clean and useful as your business grows. A well-kept CoA is a powerful tool for clarity. A neglected one? It just becomes a digital junk drawer, causing confusion and leading to some pretty dodgy business decisions.
The key is shifting from a 'set it and forget it' mindset to one of smart, ongoing maintenance. It’s all about creating simple, repeatable habits that stop your accounts from getting cluttered. This isn't a one-off job; it's a commitment to keeping your financial data reliable and true.
Keep It Simple and Logical
One of the biggest traps people fall into is making their chart of accounts way too complicated. It’s tempting to create a separate account for every last little expense, but that quickly leads to a bloated, unmanageable list that’s a nightmare to work with. The best advice is to start with simplicity. Only add new accounts when there's a clear, genuine business need for them.
An overly detailed chart of accounts can actually hide what’s really going on. The goal isn't to track every single pencil you buy, but to get meaningful insights into your main streams of income and where your money is going. If an account isn't helping you make a better decision, you have to ask if it really needs to be there.
This idea of structured financial organisation has been around for ages. The chart of accounts framework we use in the UK has been refined over centuries, originally for tracking public finances. You can actually explore over 300 years of UK public finance data to see how these systems evolved for the sake of clarity and good management.
Establish Consistent Naming Conventions
Another common slip-up is using vague or inconsistent names for your accounts. An account just called "Software" doesn’t tell you much. But "Software Subscriptions – Marketing"? That gives you instant clarity. A solid naming system means anyone looking at your reports, whether it’s your bookkeeper or a potential investor, can understand them without needing a secret decoder ring.
Here are a few quick tips for naming your accounts well:
- Be Descriptive: The name should explain exactly what the account is for.
- Stay Consistent: Use the same pattern for similar items (e.g., "Utilities – Gas," "Utilities – Electricity").
- Avoid Jargon: Stick to plain English unless a specific industry term is absolutely necessary.
Regularly Review and Tidy Up
Your business changes, so your chart of accounts needs to change with it. The CoA that was perfect when you were just starting out will need a few tweaks once you launch new products, hire people, or take out a loan. Make a point to schedule a review at least once a year. This is your chance to archive old, unused accounts and check that your current structure still makes sense for where your business is today.
This kind of proactive housekeeping is a cornerstone of good financial management. Tidying up your accounts regularly is just as crucial as the initial setup and is a big part of why monthly bookkeeping is essential for your business. It stops small messes from turning into massive reporting headaches later on, ensuring you have a solid financial foundation to grow on.
From Financial Setup to Strategic Insight
With a well-organised chart of accounts in place, you’ve officially moved beyond simple bookkeeping. Think of it as building a solid foundation; now you can use it to gain the strategic insights that will actually steer your business toward growth and profitability. This framework is the bridge between just recording numbers and truly understanding your financial story.
The real power of your chart of accounts shines through in its daily use. Suddenly, tasks that were once a massive headache become far more straightforward. Budgeting stops being guesswork because you can allocate funds based on precise expense categories. Forecasting your cash flow becomes much more accurate when your income and outgoings are clearly defined. Even year-end tax preparation gets easier, saving you a ton of time and stress when dealing with HMRC.
Turning Data into Decisions
A detailed CoA lets you analyse your business with a new level of clarity. You can pinpoint which of your services are the most profitable, spot creeping costs before they snowball into serious problems, and see exactly where every pound is going. This isn't just about looking back; it's about making smarter decisions for the future.
Beyond just tracking your finances, a solid chart of accounts is the bedrock for strategically optimizing resource allocation across the business. When you know precisely how every pound is working towards your goals, you can invest with confidence and cut spending with precision. It ensures your capital is always working its hardest for you.
Your chart of accounts transforms raw financial data into actionable intelligence. It’s the tool that helps you answer the most important questions: Where should we invest next? How can we improve our margins? Are we on track to hit our annual goals?
Knowing When to Call in an Expert
As your business grows, its financial needs will get more complex. While a great CoA gives you tremendous control, there are clear signs that it’s time to bring in a professional bookkeeper or chartered accountant for guidance.
Consider reaching out for expert help if:
- You spend more time on bookkeeping than on your core business. Your time is your most valuable asset; use it wisely.
- You are unsure how to handle complex transactions. This could be anything from asset depreciation and shareholder loans to multi-currency accounting.
- You need help with strategic financial planning. An accountant can help with forecasting, securing funding, and tax planning.
- You are facing an audit or investigation from HMRC. In these situations, professional representation is absolutely crucial.
Hiring an expert isn’t a sign of failure—it’s the next logical step toward gaining total financial control. They can help you refine your chart of accounts, ensure you’re compliant, and unlock the deeper strategic insights hidden in your data.
Frequently Asked Questions
Even with a perfectly designed system, questions always come up. It's one thing to set up your chart of accounts, but knowing how to maintain it is just as important. Here are a few of the most common queries I hear from business owners.
Getting these details right is crucial. It’s what keeps your financial data clean, accurate, and genuinely useful for making those big decisions. Let's clear up a few points.
How Often Should I Review My Chart of Accounts?
Your business changes, and your chart of accounts needs to keep up. Think of it as a living document, not something you set in stone and forget about.
For most businesses, a thorough review once or twice a year is a good rhythm. This gives you a chance to step back and make sure it still reflects how you actually operate.
That said, certain events should trigger an immediate look, no matter when your last review was. These include:
- Launching a new product or service. You'll need fresh revenue and cost accounts to see if it's actually making money.
- Taking on a big loan or new investment. This means adding new liability or equity accounts to track those funds properly.
- Opening a new location or department. You might want to create specific expense accounts to keep a close eye on how the new venture is performing.
Can I Change My Chart of Accounts Later?
Absolutely, but you need to be careful. Just diving in and making changes can mess up your historical data, creating a real headache when it's time to run reports.
The golden rule is to edit or archive accounts, don't delete them. If an account has past transactions tied to it, deleting it can throw your old reports out of whack. Instead, you can add new accounts for new activities and archive the old, unused ones. This keeps your active list clean without erasing your financial history.
Think of your chart of accounts like the floor plan of your financial house. You can add a new room or re-purpose an existing one, but you wouldn’t just knock down a load-bearing wall without a proper plan. Careful changes keep the whole structure sound.
What Is the Difference Between a Chart of Accounts and a General Ledger?
This is a classic point of confusion, but there’s a simple way to think about it.
Picture your company's entire financial history as a massive book.
- The Chart of Accounts (CoA) is like the table of contents at the front. It lists all the chapter titles (your account names and numbers) and shows you exactly how the book is organised.
- The General Ledger (GL) is the book itself. It contains every single page, detailing every transaction that has ever happened, all filed neatly under the right chapter heading.
In short, the CoA provides the structure, and the GL holds all the detail. You can't have one without the other; they work hand-in-hand to give you a complete and organised financial picture.
Sorting out your chart of accounts can feel a bit complex, but it’s one of the most important things you can do for the financial health of your business. If you need a hand building a solid financial framework or just want to ensure everything stays accurate, the team at Stewart Accounting Services is here to help. See how our professional accounting and bookkeeping services can bring clarity and control to your finances.