

When you're trying to figure out if your business is actually making money from the things you sell, the gross profit margin is your most important guide. It cuts through the noise of other business expenses and tells you exactly what percentage of your revenue is left over after you've paid for the direct costs of producing your goods or services.
Think of it this way: it’s a pure measure of how efficiently you turn your raw materials and direct labour into cold, hard profit.
Getting to Grips with Your Core Profitability
Let's imagine your total revenue is a freshly baked cake. The Cost of Goods Sold (COGS)—things like flour, sugar, and the baker's time—is the first slice you have to cut out. Your gross profit margin is the percentage of the cake you have left after that first essential slice has been served.
Why does this matter so much? Because that remaining cake tells you a few critical things:
- How good are you at making your product? A healthy margin means you’re keeping your production costs in check.
- Is your pricing right? If the margin is razor-thin, it could be a sign that your prices are too low to comfortably cover your costs.
- What’s the true health of your core business? It offers a crystal-clear signal of your profitability at the most fundamental level—the creation and sale of your product.
Nailing this metric is the first real step to understanding your company’s financial foundations. The image below shows how it’s defined and why it's a go-to metric for financial analysis.

As you can see, the gross margin is calculated before you even think about deducting overheads, wider company payroll, or taxes. It’s all about the profitability of your primary business activities, plain and simple.
To make this even clearer, here’s a quick summary of the essentials.
Gross Profit Margin Essentials
This table breaks down the core components of the gross profit margin, giving you a straightforward way to see how the metric works in practice.
| Metric | Formula | Example |
|---|---|---|
| Gross Profit Margin | (Total Revenue – COGS) / Total Revenue x 100 | You sell a t-shirt for £25. The material and labour cost £10 (your COGS). Your gross profit is £15. Your gross profit margin is (£15 / £25) x 100 = 60%. |
This simple calculation instantly reveals that for every pound you make in revenue, 60 pence is gross profit available to cover all your other business expenses and, hopefully, contribute to your net profit.
Getting to Grips with Profitability
Before we dive into the numbers, let’s get a real feel for what we’re talking about. Think of your total sales revenue as a big, freshly baked cake. It represents every single pound your business brings in.
Now, to make that cake, you needed ingredients—flour, sugar, eggs. You also needed someone to bake it. The cost of those ingredients and the baker's wages are your Cost of Goods Sold (COGS). This is the slice of the cake that covers the direct costs of what you sell.
What’s left of the cake after you’ve accounted for that slice? That’s your gross profit. The gross profit margin simply tells you how big that leftover piece is as a percentage of the whole cake.
Direct Costs vs. Operating Expenses
It's easy to get tangled up here, but the difference between direct costs and other business expenses is crucial. COGS covers only the costs directly tied to producing your goods or delivering your service. Everything else falls under the umbrella of operating expenses.
Let’s stick with the bakery example:
- COGS (Direct Costs): The flour, chocolate, and packaging for a box of brownies.
- Operating Expenses (Indirect Costs): The rent on the shop, your marketing budget, and the salary for your sales assistant.
Gross profit margin deliberately ignores all those operating expenses. Its job is to zoom in on how efficiently you produce and price your core offerings, separate from the general costs of keeping the lights on.
This is precisely why it’s such a powerful metric. It gives you a clean, unfiltered look at your production efficiency and pricing power, right at the source.
Getting this right is fundamental to understanding your financial health. Profitability isn't a fixed target; it moves with the market, supplier prices, and the wider economy. In fact, historical data shows just how much corporate profitability has fluctuated in the UK over the years, as detailed in this economic analysis on long-term trends.
Once you’ve mastered these basics, you'll be able to read your financial statements with much more confidence. To see how gross profit margin fits into the bigger picture, take a look at our guide on the key financial metrics every business owner should monitor.
How to Calculate Gross Profit Margin
Working out your gross profit margin is refreshingly simple, but don't let that fool you. This one calculation cuts through all the noise in your finances to show you how profitable your products or services truly are at their core.
The formula itself is straightforward:
(Total Revenue – Cost of Goods Sold) / Total Revenue x 100
Let’s bring this to life with a real-world example. Imagine you run a local bakery. Last year, you brought in £100,000 from selling your delicious bread and pastries. That figure is your Total Revenue.
Of course, it costs money to make those goods. You spent £40,000 on all the direct ingredients like flour, sugar, and yeast, plus the wages for your bakers. This is your Cost of Goods Sold (COGS).
Putting the Formula into Action
First, we need to find your gross profit, which is simply what's left after you subtract the cost of making the goods from the sales revenue.
- £100,000 (Revenue) – £40,000 (COGS) = £60,000 (Gross Profit)
Now, to turn that into a margin, we see how it stacks up against your total revenue.
- (£60,000 / £100,000) x 100 = 60%
There you have it. Your gross profit margin is 60%. This tells you that for every pound you make in sales, you have 60 pence left over to pay for everything else – things like rent, marketing, and admin salaries. You'll find the revenue and COGS figures you need on your company’s profit and loss statement. If you're new to these reports, our guide on accounting basics like the profit and loss report is a great starting point.
This logic applies to any business. For instance, the UK's retail grocery sector often operates on much tighter gross margins, typically between 30% and 35%. This just goes to show how razor-sharp their operational efficiency needs to be to turn a profit. For a different perspective, you can see how these principles work in a specialised niche by checking out a property-specific tool like a fix and flip calculator, which is designed to analyse profit potential on a project-by-project basis.
The simple flow chart below breaks down the key steps involved in analysing and improving your gross profit margin.
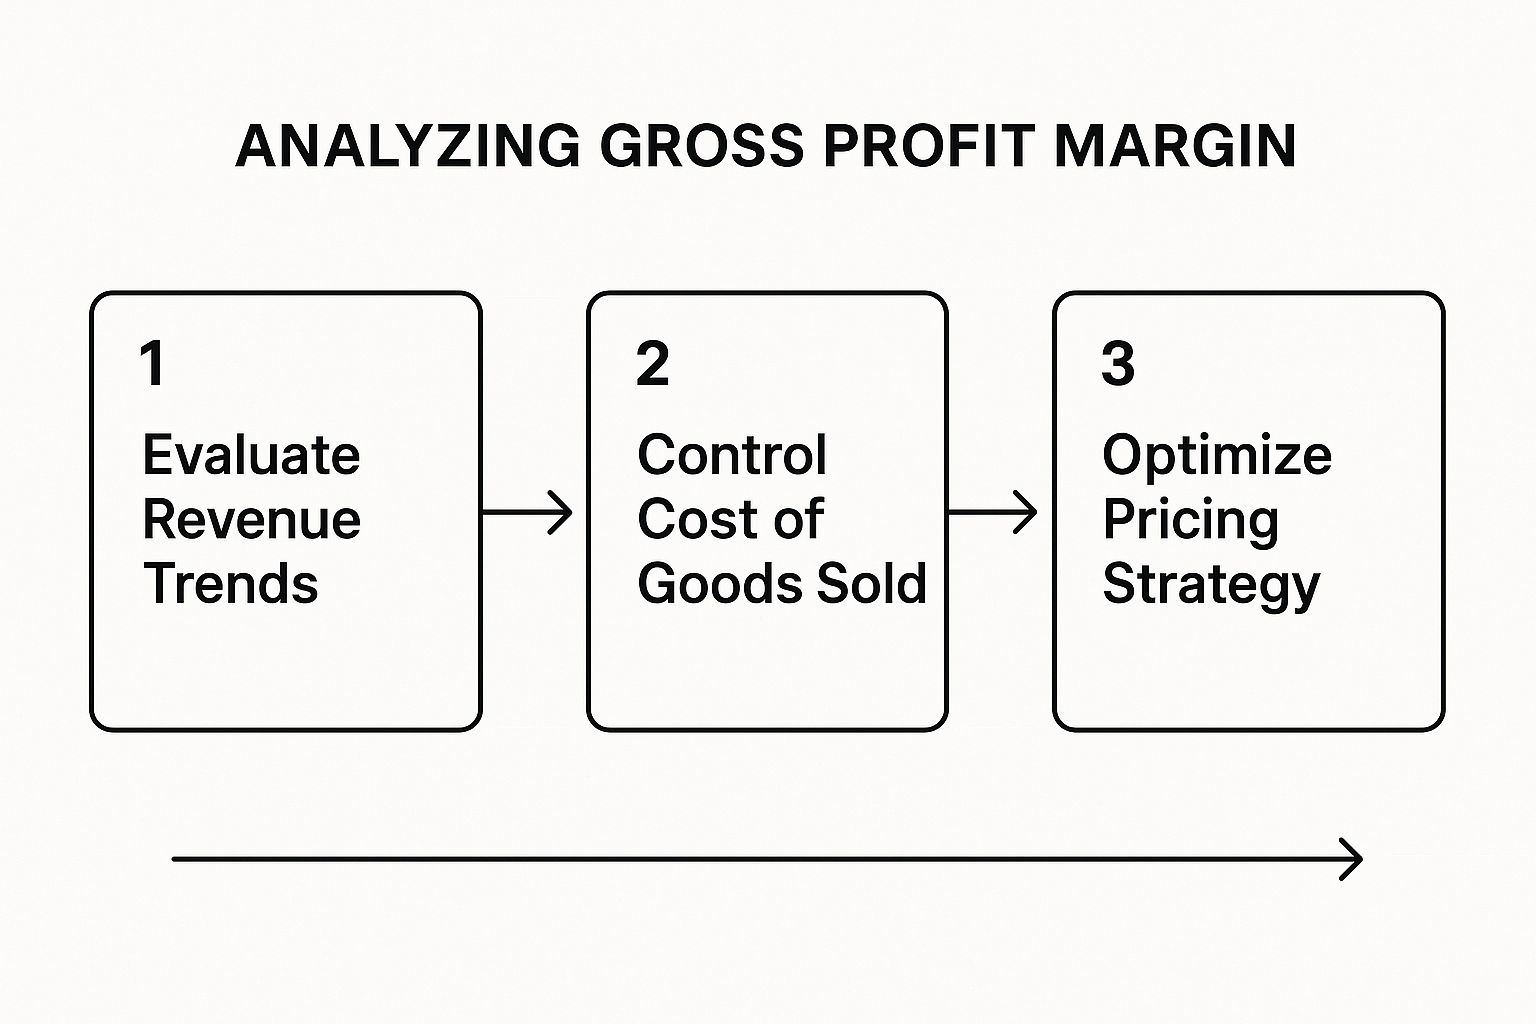
As the visual shows, calculating the margin is just the beginning. The real value comes from using that number to evaluate your revenue streams, get a handle on your costs, and fine-tune your pricing strategy.
Interpreting Your Margin and Industry Benchmarks
Getting your gross profit margin calculated is one thing, but knowing what to do with that number is where the real insight lies. A 40% margin could be fantastic news for a retailer but a serious problem for a software firm. It all depends on your industry.
Think of this figure as a quick health check for your core business operations. A healthy, high margin shows you’re pricing your products well and keeping the costs of producing them under tight control. A low margin, however, can be an early warning sign that your prices are too low or that your direct costs are spiralling.
Comparing Your Performance to the Competition
To get a true sense of how you're doing, you need to look beyond your own accounts and see how you stack up against the competition. Industry benchmarks are your guide here; without them, you’re essentially guessing at what "good" looks like.
For example, a software business with very few direct costs might easily hit a gross profit margin of over 75%. In contrast, a local restaurant dealing with daily food and drink costs might be doing incredibly well with a margin closer to 35%. The difference comes down to their unique cost structures.
Benchmarking isn't just about trying to match what your competitors are doing. It's about understanding what's realistically possible in your sector and spotting where your own business could be more efficient.
Average Gross Profit Margins Across UK Industries
Looking at what's typical for your industry helps you set realistic goals and quickly identify if something is wrong. If your margin is miles below the average for your sector, it's a clear signal to dig into your pricing strategy and your cost of goods sold.
The table below gives you a comparative look at typical gross profit margin ranges in key UK sectors to help you contextualise your own business performance.
| Industry | Margin Range |
|---|---|
| Retail (Grocery) | 30% – 35% |
| Software as a Service (SaaS) | 70% – 85% |
| Construction | 15% – 25% |
| Restaurants & Hospitality | 35% – 45% |
As you can see, the definition of a "good" margin varies dramatically. That's why context is so critical when you're analysing your own numbers.
It's also crucial to track your own margin over time. A consistent downward trend is a massive red flag. It can alert you to rising supplier costs or mounting price pressure in the market, giving you a chance to react before your bottom line takes a serious hit.
Gross Profit Margin in the Real World: A Look at UK Supermarkets
Theory is one thing, but seeing how gross profit margin plays out in the real world is where it all clicks. Let's dive into the UK supermarket sector—it’s a perfect case study of a high-volume, low-margin industry where every penny counts.
Think about the big names like Tesco or Sainsbury's. They’re locked in a constant price war to win over shoppers, but at the same time, they're juggling the huge costs of everything they put on the shelves. This relentless pressure directly impacts their gross profit margin.
When you buy a loaf of bread for £1.50, a hefty chunk of that money goes straight back to the supplier who baked it. The little bit left over is the supermarket's gross profit on that loaf. Now, multiply that by millions of products.
From Gross Profit to the Bottom Line
For these retail giants, gross profit is just the starting line. That initial slice of profit has to cover a mountain of other expenses before the business actually makes any money. These are the operating costs, and they are enormous.
- Store Costs: Rent, business rates, and the electricity bill for thousands of stores nationwide.
- Staff Wages: Paying everyone from the checkout team and shelf-stackers to head office staff.
- Distribution: The fuel, drivers, and maintenance for a massive fleet of lorries crisscrossing the country.
- Marketing: All those TV adverts, online promotions, and loyalty schemes.
This is why a supermarket's gross margin is always going to look much healthier than its final operating margin. The slim profits made after paying for the goods are stretched incredibly thin to keep the whole operation running.
The tightrope walk between competitive pricing and operational cost control defines the financial reality for UK supermarkets. Their success hinges on managing pennies efficiently across millions of transactions.
This constant squeeze is clear when you look at their final profit figures. Detailed analysis of the sector shows that UK supermarkets' operating margins have historically been razor-thin, often hovering between just 2% and 6%. It’s a stark reminder of how critical managing that initial gross profit is for survival.
If you want to dig deeper, you can explore this in-depth groceries market report to see just how real businesses navigate profitability under such intense market pressure.
Actionable Strategies to Improve Your Gross Profit Margin

Boosting your gross profit margin isn’t about slashing costs blindly. It’s a game of smart, targeted adjustments to how you price your products and manage your operations. The best part? Even small, consistent changes can make a huge difference to your bottom line.
Fundamentally, you have two main dials to turn: you can either increase what you make from each sale, or you can reduce the Cost of Goods Sold (COGS). Most successful businesses I’ve seen tackle both at once. If you’re looking for a deep dive, there are many strategies to improve profit margins out there that can help build a much stronger financial footing.
Trimming Costs and Driving Up Revenue
So, where do you start? The key is to focus on actions that give you the biggest bang for your buck. A two-pronged attack on costs and revenue usually delivers the most lasting results, making your business more resilient in the long run.
Here are a few powerful tactics you can put into practice:
- Renegotiate with Your Suppliers: Don't just accept your supplier agreements as final. Make it a habit to review your contracts and ask for better rates, particularly if you’ve become a bigger or more reliable customer.
- Raise Your Prices Strategically: If you've enhanced your product or are offering a better service, your prices should reflect that new value. Even a modest price increase flows directly into your profit margin on every single sale.
- Cut Down on Production Waste: Take a hard look at your production line. Every bit of wasted material or inefficient use of time is money straight out of your pocket.
When you zero in on efficiency, you’re not just cutting direct costs—you’re building a stronger, more streamlined business. This makes it far easier to grow profitably as you scale up.
Remember, these tactics are just one piece of the puzzle. For a broader look at operational health, have a read of our guide on the 4 easy ways to reduce the cost of operations for your business.
Your Gross Profit Margin Questions, Answered
When you're getting to grips with your business finances, a few common questions always seem to pop up. Let's clear up some of the most frequent queries about gross profit margin to help you feel more confident with the numbers.
What’s the Difference Between Gross and Net Profit Margin?
Think of it like this: gross profit margin is your first look at profitability, while net profit margin is the final verdict. Gross profit margin tells you how much money you make from your core business activity—selling your product or service—before you account for overheads like rent, marketing, or salaries.
Net profit margin, however, is what's left at the very end. It's the profit that remains after every single cost—from the cost of goods sold to operating expenses, interest, and taxes—has been deducted. It’s the true measure of your overall profitability.
How Often Should I Calculate It?
For most businesses, running the numbers on a monthly or quarterly basis strikes the right balance. This gives you a regular, up-to-date picture of your financial health.
Calculating it this often means you can spot a problem—like a supplier price hike—and react quickly, rather than waiting until the end of the year when it might be too late.
When you track this metric regularly, it stops being just a number on a report and becomes a powerful tool for making smart, timely decisions.
Can Things Outside My Business Affect My Gross Profit Margin?
Definitely. Your gross profit margin doesn't exist in a bubble; it's often at the mercy of wider economic shifts you can't control.
- Supply Chain Problems: A shipping crisis or a shortage of raw materials on the other side of the world can directly increase your costs and shrink your margin.
- Fierce Competition: If a competitor starts a price war, you might have to lower your own prices, which will inevitably hit the profit you make on each sale.
- Inflation: When inflation rises, your suppliers will likely charge you more. If you can't pass those costs on to your customers, your margin takes the hit.
At Stewart Accounting Services, we help businesses across the UK get to the bottom of their numbers and build solid plans for the future. If you need a clearer view of your financial performance, get in touch with our expert team today.