

Think of management reporting as the instrument panel for your business. It’s the process of gathering data from across your company and translating it into clear, insightful reports for your internal teams. These aren't just generic spreadsheets; they are custom-built tools designed to help managers make better, faster decisions to keep the business on track.
The Dashboard Driving Your Business Forward

Could you imagine driving a car without a dashboard? No speedometer, no fuel gauge, no warning lights. It would be incredibly risky. Running a business without solid management reporting is the exact same thing—you’re essentially flying blind.
These reports act as your company’s command centre, turning a sea of complex data into a clear picture of what’s really going on. Unlike the formal financial statements you prepare for the tax man or investors, management reports are for your eyes only. Their job isn’t just to report on what happened last month, but to give you the foresight needed to shape what happens next.
What Makes Management Reports Different?
The real difference comes down to who they're for and what they do. While it's crucial to understand the three most important financial reports that are outward-facing, management reports are laser-focused on what’s happening inside the business.
Because they're for internal use, they don't have to follow strict, formal accounting rules. Their power lies in being relevant and timely, not just compliant.
Here’s what sets them apart:
- Operational Focus: They get right into the nitty-gritty of how specific departments are performing, how projects are progressing, and where the operational bottlenecks are.
- Forward-Looking: Many of these reports are built to look ahead, using forecasts and trend analysis to help you anticipate what’s around the corner.
- Highly Customised: They are created to answer specific questions for specific people. A sales director’s report will look completely different to one for the head of operations.
- Timely and Frequent: They can be run daily, weekly, or monthly—whatever it takes to give you a real-time pulse on business performance.
Management reports aren’t just a collection of numbers. They are strategic communication tools. They tell the story of what’s happening in your business, showing you what’s working, what’s not, and where you need to focus your attention.
Ultimately, great management reporting creates a vital feedback loop. It bridges the gap between your high-level strategy and the day-to-day work, ensuring everyone is pulling in the same direction and every decision is grounded in solid data.
The table below gives a quick snapshot of the core components.
Management Reporting at a Glance
| Component | Description | Example |
|---|---|---|
| Audience | Primarily internal leaders, including department heads, directors, and C-suite executives. | A weekly sales performance report for the Head of Sales. |
| Purpose | To inform strategic planning, improve operational efficiency, and drive decision-making. | Using a budget vs. actuals report to adjust departmental spending. |
| Content | A mix of financial and non-financial data, often customised to specific business units. | A project management report tracking milestones, timelines, and resource allocation. |
| Frequency | Varies based on need, from daily dashboards to monthly summaries. | A daily cash flow statement for the finance team. |
This at-a-glance view helps clarify how each element works together to create a powerful internal guidance system for your business.
Why Management Reporting Is Your Secret Weapon

It’s one thing to know what management reporting is, but it’s another thing entirely to grasp what it can do for your business. Think of it less as a stuffy, administrative task and more as a dynamic tool that turns raw, messy data into your most powerful asset for smart decision-making.
When done right, management reports deliver three game-changing advantages for any growing business. They sharpen your strategic thinking, supercharge your daily operations, and build a real culture of accountability. Let's break down why this isn't just a chore, but a genuine competitive edge.
Enabling Smarter Strategic Decisions
Every leader has to grapple with big, make-or-break questions. Should we expand into a new region? Is now the right time to launch that product? Do we double down on our marketing spend? Without solid data, you're just guessing. Management reports act as your strategic compass, helping you navigate these choices with confidence.
Imagine you're weighing up an expansion. A report breaking down customer lifetime value (CLV) by region might show that one area delivers far more profitable customers over the long haul. That single insight can reshape your entire growth plan, pointing you exactly where your investment will yield the best results.
It’s about turning hindsight into foresight. A market trends report could flag an emerging customer need or a gap left by a competitor, giving you a priceless window to get ahead. Instead of just reacting to the market, you start anticipating it. That's what separates the leaders from the followers.
Boosting Operational Efficiency
Strategy is crucial, but what about the day-to-day grind? This is where management reporting really shines a light on the inner workings of your business, exposing the hidden leaks that quietly drain your resources. It’s the key to answering questions like, "Why is this project always late?" or "Which department is haemorrhaging cash?"
Take a logistics manager at a delivery firm. Their daily reports keep flagging that one specific route consistently takes 25% longer than any other, even though it's not the longest distance. The data doesn't just present the problem; it demands a closer look.
By digging into the numbers, the manager realises the delays are all down to predictable city centre traffic at a certain time of day. The fix is simple: reschedule those deliveries for an earlier slot. The result? Fuel saved, overtime cut, and happier customers.
That’s the real, tangible impact. It's about finding the small cracks that, left unchecked, can cause major damage. This cycle of continuous improvement is what keeps a business profitable and a step ahead of the competition.
Driving Accountability and Performance
A business thrives when every person understands their role and sees how their work fits into the bigger picture. Management reporting is the glue that holds this all together, creating transparency and fostering a genuine sense of ownership across the board.
For instance, a sales director can pull up a dashboard showing each team member's progress against their quarterly targets. This isn't about micromanaging; it’s about providing clarity. The data quickly highlights who is flying and who might need a bit of extra coaching to get them over the line.
When performance is measured with clear, visible metrics, conversations change. They move away from subjective feelings and towards objective facts. This leads to far more constructive performance reviews and helps everyone pull in the same direction. When the entire team knows the score, they’re motivated to play their best game.
The Key Management Reports Every Business Needs
So, we've covered what management reporting is and why it's so important. Now, let's get down to brass tacks. It's easy to get lost in a sea of data and potential reports, but you don't need hundreds of them to get a clear picture of your business's health. In reality, a handful of core documents will do most of the heavy lifting.
Think of it like a car's dashboard. You have a few critical dials—speed, fuel, engine temperature—that tell you everything you need to know at a glance. Your management reports serve the same function. We can group these essential "dials" into three main areas: Finance, Sales, and Operations. Together, they provide a complete, 360-degree view of your company's performance.
This focused approach is particularly vital for the small and medium-sized enterprises (SMEs) that form the backbone of the UK economy. In early 2024, SMEs accounted for a staggering 99.9% of all private sector businesses. These 5.5 million firms are the country's economic engine, employing nearly 60% of all private sector workers.
Yet, they face significant hurdles. A recent survey found that 41% of SME employers see regulations and red tape as a major obstacle to their growth. This is where sharp, efficient internal reporting becomes a real competitive advantage—it helps cut through the noise. You can dive deeper into the UK's business landscape with insights from money.co.uk.
Essential Financial Reports
Your financial reports are the foundation of it all. They're not just about counting money; they're about understanding its journey—where it comes from, where it goes, and how much is left to keep the lights on and fund your ambitions. Get this wrong, and even the most brilliant business idea can stumble.
For any business, two financial reports are absolutely non-negotiable:
-
Cash Flow Forecast: Think of this as your financial early-warning system. It looks ahead—usually over the next three to six months—to predict the cash moving in and out of your business. It answers the one question that keeps every business owner up at night: "Will we have enough cash to pay our bills?" By spotting potential shortfalls in advance, you have time to act, whether that's chasing invoices, arranging a line of credit, or trimming costs.
-
Budget vs. Actuals Report: This is your financial reality check. It simply compares what you planned to spend (your budget) with what you actually spent. It’s the ultimate accountability tool, immediately highlighting where you're overspending. This report forces you to ask the tough questions and get spending back on track before it derails your plans.
A company can be profitable on paper and still go bust because it runs out of cash. That's why the Cash Flow Forecast is arguably the single most important report for an SME. It’s the lookout in the crow's nest, spotting icebergs long before they become a problem.
These two reports give you the solid financial ground you need to make smart decisions everywhere else in the business.
Crucial Sales Reports
If finance is the foundation, your sales team is the engine. Sales reports tell you how smoothly that engine is running. They move beyond just looking at the final revenue number and dig into the health of your sales pipeline and the effectiveness of your team. This is how you forecast future income with confidence and fine-tune your sales approach.
Every sales leader should have these reports at their fingertips:
- Sales Pipeline Analysis: This gives you a bird's-eye view of every single deal your team is working on, from the first "hello" to the signed contract. It helps answer the critical question: "How much revenue can we realistically expect next quarter?" More than that, it reveals bottlenecks in your sales process—those tricky stages where promising deals seem to get stuck.
- Team Performance Dashboard: This is where you see who's firing on all cylinders and who might need a bit of extra coaching. It tracks the key metrics for each salesperson—deals closed, conversion rates, call volume—to show you what good looks like. It answers the simple question: "Is my sales team hitting its full potential?"
With this level of insight, sales managers can stop guessing and start making data-driven decisions about who to train, where to allocate resources, and what realistic targets look like.
Key Operational Reports
Finance looks after the money and sales brings it in, but operations is all about delivering on your promises. These reports focus on efficiency, productivity, and quality. They ensure your business runs like a well-oiled machine, turning sales promises into happy customers.
Two reports are fundamental for keeping your operations on track:
- Project Milestone Tracker: If your business runs on projects, this is your lifeline. It tracks your progress against key deadlines and deliverables, giving you a crystal-clear view of whether a project is on schedule, at risk, or already falling behind. It answers the all-important question: "Will we deliver this on time and on budget?"
- Inventory Turnover Report: For any business holding stock—from retailers to manufacturers—this is a must-have. It measures how quickly you're selling and replacing your inventory. A slow turnover might mean you have cash tied up in products that aren't selling, while a rate that’s too fast could mean you're missing out on sales. It helps you answer: "Are we managing our stock as efficiently as possible?"
These reports empower your managers to spot problems early, manage their resources wisely, and make sure the core engine of your business is running at peak performance.
Key Management Report Types and Their Functions
To bring it all together, different reports serve different functions, but they all aim to provide clarity for decision-making. The table below breaks down the most common types, their primary purpose, and the kind of metrics you'd expect to see in each.
| Report Type | Primary Purpose | Common Metrics Included |
|---|---|---|
| Financial | To monitor financial health, liquidity, and profitability. | Revenue, Profit Margin, Cash Flow, Budget vs. Actual Spend, EBITDA. |
| Sales | To track revenue generation and sales pipeline effectiveness. | Sales Growth, Customer Acquisition Cost (CAC), Conversion Rate, Pipeline Value. |
| Operational | To measure business process efficiency and productivity. | Inventory Turnover, Project Completion Rate, Production Output, Employee Utilisation. |
| Marketing | To assess the ROI and impact of marketing campaigns. | Website Traffic, Lead Generation, Cost Per Lead (CPL), Customer Lifetime Value (CLV). |
| Project | To monitor the progress, budget, and timeline of specific projects. | Milestones Achieved, Budget Adherence, Resource Allocation, Task Completion Rate. |
This isn't an exhaustive list, but it covers the core areas that give managers the visibility they need. By selecting the right reports for each function, you build a comprehensive dashboard that guides your entire business strategy.
How to Build a Powerful Reporting Framework
Great, insightful reporting doesn't just happen by magic. It’s the result of a deliberate, well-structured process designed to turn raw data into a clear roadmap for your business. Building this framework is a bit like constructing a house: you need a solid foundation, a clear blueprint, and the right tools for the job.
Without that structure, you risk drowning in a sea of irrelevant numbers or, even worse, making critical decisions based on flawed information. A robust framework ensures every report you create is relevant, accurate, and directly linked to your business objectives. It's a system that delivers clarity, not confusion.
The infographic below outlines the first three essential stages for building a reliable reporting framework.
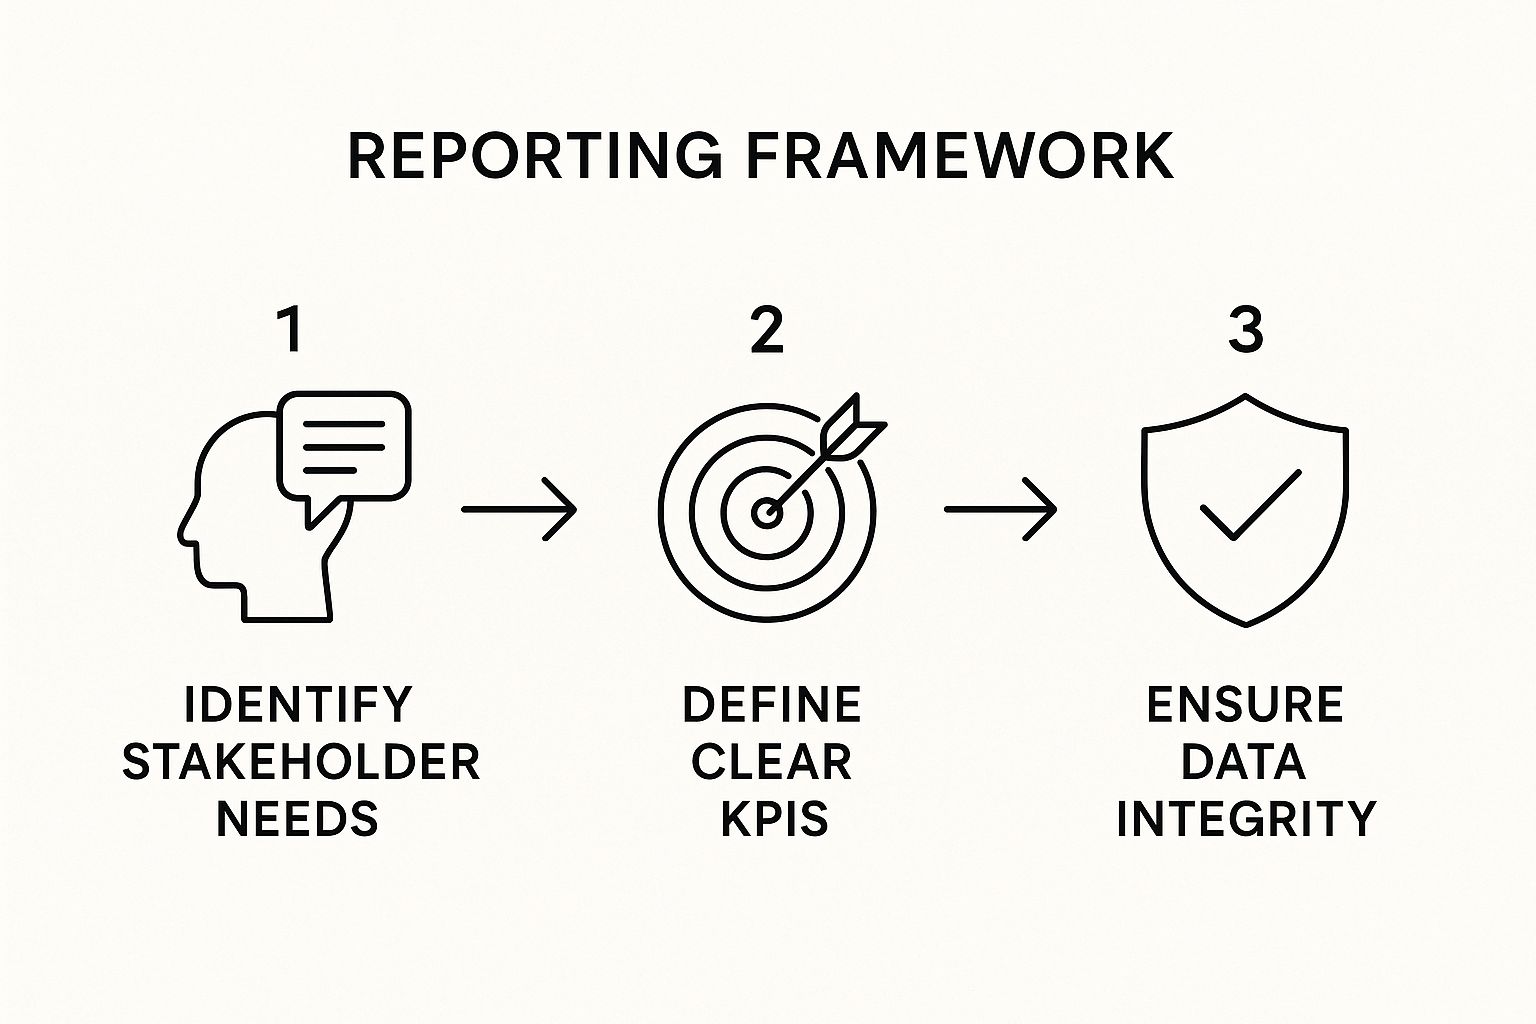
As you can see, successful reporting starts with people and goals, not with spreadsheets or software. Each stage builds on the last, creating a logical path from understanding what people need to know to ensuring the data can be trusted to tell them.
Start by Identifying Stakeholder Needs
The first, and most critical, step is to figure out what your stakeholders actually need to know. A report is only useful if it answers the right questions for the right people. Before you even think about creating a chart, sit down with your key decision-makers—from department heads to the CEO—and have a real conversation.
What keeps them up at night? What information would genuinely make their jobs easier? In their view, what are the true indicators of success for their part of the business?
By starting here, you avoid the common trap of producing reports that are packed with data but completely empty of insight. You make sure every piece of information serves a clear purpose and helps someone make a better, more informed decision.
Define Your Key Performance Indicators
Once you know what your stakeholders need to measure, the next job is to translate those needs into specific, quantifiable metrics. These are your Key Performance Indicators (KPIs). Good KPIs aren't just random numbers; they are directly tied to your biggest business goals.
For instance, if your goal is to increase customer loyalty, a relevant KPI might be your Customer Churn Rate or Net Promoter Score (NPS). If you’re focused on operational efficiency, you might track Cost Per Unit or Order Fulfilment Time.
A KPI should be a signpost that tells you if you are on the right road to achieving your strategic goals. If a metric doesn't directly connect to a core business objective, it's probably not a key performance indicator.
The trick is to choose a small, focused set of KPIs for each area of the business. Trying to track dozens of metrics at once is a recipe for distraction and confusion.
Ensure Data Integrity and Accuracy
With your KPIs defined, it's time to turn your attention to the data itself. This stage is absolutely crucial. Remember the old saying: "garbage in, garbage out". It’s a constant threat to effective management reporting, because your insights are only as good as the data they're built on.
This involves two key actions:
- Pinpoint Your Data Sources: Identify exactly where the information for each KPI will come from. Is it your CRM system, your accounting software, or your website analytics?
- Implement Data Quality Checks: Put processes in place to ensure the data is accurate, complete, and consistent. This might involve regular manual audits or setting up automated validation rules.
In the UK, data quality is paramount. The UK Statistics Authority’s recent annual report highlights just how important reliable business surveys are for economic insights. For example, key surveys that feed into national statistics showed strong but varied response rates: the Monthly Business Survey was at 72.7%, the Monthly Wages and Salary Survey hit 81.9%, and the Business Register and Employment Survey reached 80.1%. These figures show the continuous effort required to maintain high-quality data, a principle that applies just as much to your internal reporting. You can learn more from the UK Statistics Authority’s 2024/25 report.
Choose the Right Reporting Tools
Now that you have your KPIs and trusted data sources, it’s time to pick the tools to bring it all together. The right tool really depends on your business's complexity and budget. For some, a well-organised spreadsheet is perfectly fine. For others, a more powerful solution is needed.
- Spreadsheets (e.g., Excel, Google Sheets): These are ideal for smaller businesses or straightforward reporting. They're flexible and low-cost but can become clunky and prone to errors as you scale.
- Business Intelligence (BI) Platforms (e.g., Tableau, Power BI): These tools are built to handle large datasets from multiple sources, offering slick data visualisation and automated dashboards.
- Accounting Software (e.g., Xero, QuickBooks): Many modern accounting platforms have fantastic built-in reporting features that are excellent for financial and sales-related KPIs.
For a more structured starting point, consider a pre-built system. You can get a feel for how a professional framework is organised with our expert-designed management accounts template.
Establish a Consistent Reporting Cadence
Finally, set up a regular schedule for creating and sharing your reports. The right frequency—or cadence—depends on the nature of the data and the decisions it informs.
- Daily: Best for fast-moving operational metrics like website traffic or daily sales figures.
- Weekly: Suited for tracking team performance or project progress.
- Monthly: Ideal for higher-level financial summaries and strategic reviews, like a budget vs. actuals analysis.
Consistency is everything. When your team knows they can expect a specific report at a specific time, it becomes an integrated part of their workflow and decision-making rhythm. This transforms reporting from an occasional chore into a continuous source of guidance.
Crafting Reports That People Actually Read

Let’s be honest. Even the most brilliant data is completely useless if it’s locked away in a report that no one reads. A report that just gathers digital dust in an inbox is a huge missed opportunity. So, the final piece of the puzzle is learning how to present information in a way that actually grabs attention, tells a coherent story, and inspires action.
The real goal here is to turn a dense, intimidating spreadsheet into a compelling narrative. It's not about making things look pretty for the sake of it; it's about making them effective so managers can understand the situation at a glance and know what to do next.
The Power of Visual Storytelling
We’re wired to be visual. Our brains process images and patterns thousands of times faster than we can decipher lines of text or columns of numbers. That’s why good data visualisation isn’t just a ‘nice-to-have’ – it’s fundamental to creating management reports that actually work.
Choosing the right kind of chart can be the difference between instant clarity and total confusion. Each visual has a specific job.
- Line Charts: These are your go-to for showing a trend over time. Think tracking sales performance over the last 12 months or website traffic day by day.
- Bar Charts: Perfect for comparing different categories side-by-side. Use them to see how sales figures stack up between products or to compare the performance of marketing channels.
- Pie Charts: Best reserved for showing the composition of a whole – how different parts make up 100%. A classic example is breaking down your customer base by region.
- Heat Maps: Fantastic for showing hotspots of activity. You could use one to identify the most-clicked areas of your website, for instance.
The secret is to pick the visual that tells your story most clearly, allowing a manager to grasp the key takeaway in seconds.
Adding a Narrative to Your Numbers
Data without context is just noise. A chart showing a 15% drop in sales is alarming, sure, but it doesn't explain why it happened or what needs to be done about it. This is where you add the narrative.
Think of yourself as a translator. Your job is to take the raw data and turn it into a simple, straightforward business story. Every report should include a brief summary that answers the all-important "so what?" question.
For example, instead of just showing a graph of declining website traffic, your narrative could add:
"As the chart shows, organic traffic fell by 15% last month. This drop coincided with a major Google algorithm update, and our initial analysis suggests our ranking for key terms was affected. The marketing team is now focused on updating our content to align with the new guidelines."
See the difference? This short explanation provides context (the algorithm update), points to a cause (ranking drop), and outlines the immediate next step (content updates). It transforms a passive piece of data into an active tool for management.
Best Practices for Readability and Impact
Beyond visuals and a clear narrative, a few simple design principles can make a world of difference in how your reports are received. A clean, focused, and consistent report is one that gets read.
-
Focus on What’s Critical: Don't throw every metric you have into a single report. It’s overwhelming. Stick to the handful of KPIs that truly matter for that specific audience and purpose. Less is almost always more.
-
Keep the Design Clean: Use a consistent layout, clear headings, and plenty of white space to let the information breathe. A cluttered report is an unreadable one. A simple colour scheme that doesn't distract from the data is always a safe bet.
-
Make It Easy to Access: Friction is the enemy. Make sure reports are effortless to find and open, whether you email them directly or host them on a shared drive or a BI platform like Tableau or Power BI.
By focusing on clarity, context, and a clean design, you’ll start creating reports that managers don't just receive – they’ll actually use them to make smarter, faster decisions that move the business forward.
The Future of Management Reporting
Management reporting is leaving its old, static self behind. We're moving away from reports that just tell you what happened last month and stepping into a far more dynamic, intelligent, and even predictive future. The technology driving this shift isn't just an upgrade; it's completely changing how we interact with our business data.
For a long time, pulling together reports was a painstaking, manual job. Think endless spreadsheets and hours spent copying and pasting. Now, Business Intelligence (BI) tools and smart automation have swept that away, giving us interactive, live dashboards instead. Leaders don't have to wait for the month-end close anymore; they can see exactly what's happening, right now, with a single click.
This change is a big reason the UK's consulting sector is now worth a massive £20.4 billion. So much of that market is built on helping businesses modernise, and these reporting tools are central to that success. With UK consulting exports set to hit £5.9 billion by 2025, it’s clear that advanced analytics are becoming the standard everywhere. You can learn more about the UK's thriving consulting industry and its influence.
The Rise of Intelligent Reporting
The next great leap is being powered by Artificial Intelligence (AI) and machine learning. These technologies are turning reporting from a simple description of the past into a powerful prediction of the future. Instead of just showing what happened, AI can start to explain why it happened and give you a solid idea of what's coming next.
Here’s a glimpse of how AI is rewriting the rules:
- Anomaly Detection: AI algorithms can sift through enormous amounts of data and instantly spot odd patterns a human might easily miss. Think a sudden drop in customer activity or an unexpected spike in production costs.
- Predictive Forecasting: By learning from your past data, machine learning models can create incredibly accurate sales forecasts, anticipate which customers are likely to leave, and even warn of potential disruptions in your supply chain.
- Natural Language Generation (NLG): Some of the most advanced tools can now write their own summaries, translating complex charts and graphs into plain English explanations of the key takeaways.
The real magic of AI in reporting is its knack for finding the "unknown unknowns." It uncovers the subtle connections and hidden trends in your data you weren't even looking for, pointing you toward new opportunities and risks.
Preparing for a Data-Driven Future
Moving to intelligent reporting is about more than just installing new software—it's about building a culture that puts data at the heart of every decision. The businesses that get this right will gain a huge edge, making choices that are not just faster, but fundamentally smarter. To get a real sense of this, it's worth exploring how AI is changing your business from the ground up.
Ultimately, the future of management reporting is one where data becomes an active partner in your business. Reports will stop being simple scorecards of the past and start acting as intelligent guides, helping you navigate the challenges of tomorrow with much more confidence. That journey has already begun.
Frequently Asked Questions
Got questions about management reporting? You're not alone. Here are some quick, practical answers to the most common queries we hear.
Management Reporting vs Financial Reporting: What's the Difference?
The easiest way to think about this is to ask who the report is for.
Management reporting is an internal affair. It's for the eyes of your managers and leadership team, designed to help them make smarter, day-to-day decisions. It’s flexible, forward-looking, and completely customised to what your business needs to know right now.
Financial reporting, however, is for the outside world – think investors, banks, or HMRC. This type of reporting is rigid and has to follow strict accounting standards (like GAAP or IFRS). It’s all about providing a formal, standardised snapshot of your company’s past financial performance.
How Often Should We Be Generating Management Reports?
There’s no magic number here; it really depends on what you're tracking and how quickly things change. The goal is to match the report's timing with the speed of your business decisions.
A good starting point looks something like this:
- Daily: For fast-moving operational numbers where you might need to react quickly. Think daily sales figures, website traffic, or production line output.
- Weekly: This is a great rhythm for keeping an eye on project progress or team performance. It allows you to spot issues and make adjustments before they become major problems.
- Monthly: Perfect for the big-picture stuff. Use this for high-level strategic and financial reviews, like comparing your budget to actual spending or analysing overall profitability.
The real aim isn’t just to produce more reports, but to deliver the right information at the right time. Over-reporting can be just as damaging as under-reporting; it just creates noise that hides what’s actually important.
What’s the First Step to Improve Our Reporting?
Before you even think about new software or fancy dashboards, the most important first step is to simply talk to the people who will use the reports.
Sit down with your managers. Ask them what keeps them up at night. What decisions are they struggling to make? What information, if they had it, would make their job a whole lot easier? Starting here ensures you're building reports that solve real problems from the get-go, rather than just producing data for the sake of it.
Ready to turn your data from a confusing mess into a clear roadmap for growth? The team at Stewart Accounting Services specialises in creating insightful management reports that give SMEs the confidence to make better decisions. Get in touch today and find the clarity you need to hit your business goals.