

At its heart, financial forecasting is about using what you know about your business's past financial performance to make educated guesses about the future. It's how you project your likely revenue, expenses, and cash flow, giving you a solid foundation for your entire business strategy—from managing daily operations to securing that next round of funding.
Why Financial Forecasting Is a Strategic Superpower

Too many business owners see financial forecasting as a painful chore, something you only do when the bank manager asks for it. But thinking of it that way means you’re missing out on one of the most powerful tools at your disposal. A solid forecast isn't just a spreadsheet full of numbers; it's the GPS for your business, giving you the clarity to navigate the twists and turns of the market with confidence.
Let's be honest: without a forecast, you’re flying blind. You might have a general sense of where you want to go, but you can’t see the sharp corners, potential roadblocks, or even the surprising shortcuts that represent golden opportunities.
Turning Data Into Decisions
What we're really talking about here is turning your historical data into actionable intelligence. This process helps you spot challenges long before they become full-blown crises and pounce on opportunities before your competitors even see them.
Just think about these real-world scenarios for a UK business:
- Securing Funding: A detailed, well-thought-out forecast is non-negotiable if you’re looking for investment. It's a critical piece when learning how to make a winning pitch deck, as it shows investors you have a credible, well-researched plan for growth.
- Strategic Hiring: How do you know when it’s the right time to hire? Your forecast will tell you. By projecting future revenue, you can see when you'll have both the need and the cash to expand your team, allowing you to hire from a position of strength, not desperation.
- Managing Cash Flow: A forecast can flag a potential cash shortfall months before it hits. This gives you precious time to arrange an overdraft, chase up overdue invoices, or adjust your spending to avoid that stomach-churning cash crunch.
A forecast isn’t a crystal ball—it’s a roadmap. Its power lies not in predicting the future with 100% accuracy, but in preparing you to respond effectively to whatever the future holds.
This forward-looking view is what enables smart, informed decisions. Can you really afford that new piece of machinery? Check the forecast. Is now the right time to launch a new service? Your projections will show you the potential impact on your bottom line.
A good forecast is built on three core financial statements. Understanding what each one does is the first step to creating a forecast you can actually rely on.
The Core Components of a Financial Forecast
| Component | What It Tells You | Key Focus for Forecasting |
|---|---|---|
| Profit & Loss Statement | Shows your company’s profitability over a period (e.g., a month or quarter). | Projecting future sales revenue and estimating all associated costs to predict net profit. |
| Balance Sheet | Provides a snapshot of your company’s financial health at a single point in time. | Forecasting assets (like cash and inventory) and liabilities (like loans) to understand future net worth. |
| Cash Flow Statement | Tracks the movement of cash in and out of your business. | Predicting cash inflows from sales and outflows for expenses to ensure you can meet your obligations. |
These three pieces work together to give you a complete picture, helping you avoid nasty surprises and plan with much greater confidence.
The Foundation of Growth
Ultimately, a reliable financial forecast allows you to stop being reactive and start being proactive. It's the difference between constantly putting out fires and actually steering the ship. By linking your day-to-day decisions to your long-term ambitions, you build a solid foundation for sustainable growth.
This entire process is a crucial part of a much broader growth strategy. To see how these financial insights fit into the bigger picture, you can learn more about our approach to business and strategic planning. It's time to stop just running your business and start directing it towards its true potential.
Gathering Your Financial Puzzle Pieces

Any good forecast is built on a solid foundation of data. Before you can even think about projecting into the future, you need to become a bit of a historian for your own business. It's all about digging into past performance to uncover the patterns and trends that will shape your predictions.
This part is non-negotiable. I've seen countless businesses create wildly optimistic (or dangerously pessimistic) forecasts simply because they skipped this step. It’s the classic "garbage in, garbage out" problem. Your goal here is to ground every single assumption in reality, and that reality is hiding in plain sight within your historical financial data.
Your Historical Data Checklist
To get started, you need a crystal-clear picture of your recent financial history. I always recommend pulling at least two to three years of detailed records. This gives you enough runway to spot seasonality, see genuine growth trends, and understand the impact of past decisions.
Here are the core documents you'll need to get your hands on:
- Profit and Loss (P&L) Statements: These tell the story of your profitability. Monthly P&Ls are gold because they reveal the short-term ups and downs that a yearly summary completely misses.
- Balance Sheets: This is a snapshot of your financial health—your assets, liabilities, and equity—at a specific moment. Comparing them over time shows how the business's structure has evolved.
- Cash Flow Statements: For my money, this is the most crucial piece of the puzzle. It tracks the actual cash coming in and going out, giving you the unvarnished truth about your ability to manage day-to-day liquidity.
Most modern cloud accounting platforms make this ridiculously easy. If you're using something like Xero or QuickBooks, you can generate these reports for custom date ranges in just a few clicks.
Remember, you're not just collecting documents. You're looking for the story behind the numbers. Where are the seasonal sales peaks? What caused that spike in expenses last May? How does your cash position ebb and flow through the year?
Locating Your Data in Accounting Software
Finding these reports is usually straightforward. In most accounting systems, you'll spot a "Reports" section in the main menu. From there, you can pick the statement you need.
Let’s walk through a quick example. Say you're using QuickBooks Online. You'd simply navigate to the 'Reports' tab and search for "Profit and Loss." You can then filter the date range to cover the last three financial years. I’d suggest exporting each year as a separate file and then running monthly reports as well to drill down into the detail.
Once you have the raw data, it's time to get it organised. A simple spreadsheet is your best friend here. I usually create separate tabs for each financial statement and lay out the data chronologically, month by month. This format makes it far easier to spot trends and run calculations later on.
Analysing Key Accounts and Trends
With your data all neat and tidy, the real analysis begins. Don't just glance at the top-line numbers. For instance, on your P&L, don't just see "Revenue." Break it down. Is it coming from a specific product line or service? Which areas are actually driving your growth?
Do the same for your expenses. Are your marketing costs flat, or do they jump around with specific campaigns? How have salary costs changed as the team has grown? These details are the very puzzle pieces you need to build a credible picture of the future. Understanding these movements is also fundamental when you learn about what working capital is and how to manage it effectively for your business's health.
Taking the time to get this data gathering phase right sets the stage for everything else. By building your forecast on a solid foundation of historical fact, you turn it from a simple guess into a powerful strategic tool.
Alright, let's get into the nitty-gritty of building a forecast that actually works for you. Once you’ve wrangled your historical data into shape, you’re at a crossroads: which forecasting method do you choose?
This isn’t just an academic question. The approach you pick will directly shape how useful your forecast is. A common trap is grabbing a one-size-fits-all template, which often spits out numbers that are completely detached from reality. Your business is unique, and your forecasting method should reflect that.
So, where do you start? The first big decision is whether you lean on hard numbers or on expert judgment.
Quantitative vs. Qualitative Forecasting
Think of quantitative forecasting as the purely logical, data-driven approach. It takes your past performance, runs it through statistical models, and projects a future based on those historical patterns. If you’re an established business with a few years of solid data, this is your bedrock. It’s objective and grounded in what’s already happened.
But what if you're a startup with no history? Or you’re launching a product in a completely new market? That's where qualitative forecasting comes in. This method is all about human insight – your team's expertise, market research, and even your gut instinct. It’s more subjective, sure, but it’s essential when the past isn't a reliable map for the future.
In my experience, the magic happens when you blend the two. Start with the quantitative data to get a baseline, then layer on qualitative insights to adjust for things the numbers can't predict. Think about a big marketing campaign you have planned, or a new competitor who just set up shop down the road. That's the kind of colour commentary that makes a forecast truly powerful.
Top-Down vs. Bottom-Up Approaches
With that foundation, you can start building your actual sales forecast. There are two main ways to tackle this: from the top down, or from the bottom up.
To make this real, let’s imagine we’re running a small, independent bookshop in the UK.
A top-down forecast is the "big picture" approach. Our bookshop owner would start with the entire UK retail book market and then carve out their tiny slice of the pie.
- Total UK book market: Let's say it's £3.5 billion.
- Our town's potential: We estimate our local area accounts for 0.01% of that, which is £350,000.
- Our shop's target: We think we can capture 30% of that local market, landing us at a £105,000 revenue target.
See how that works? It's fast and gives you a sense of your total potential. The danger, though, is that it can be a bit of a fantasy, completely disconnected from what your shop can actually handle day-to-day.
On the other hand, a bottom-up forecast is built from the ground up, using your specific operational drivers. It’s more granular and often more realistic because it’s tied directly to your activities.
For our bookshop, this means looking at the real drivers of sales. We’d think about how many people walk through the door each day, what our average customer spends, and how many days we're open. It forces you to think critically about what actually moves the needle in your business.
This level of detail is becoming critical, especially in fast-moving industries. For instance, the UK financial services sector contributed an enormous £208.2 billion to the economy in early 2025, with growth being heavily influenced by new tech. A broad, top-down guess in a market like that is useless. A bottom-up forecast that considers specific customer adoption rates and new service rollouts is the only way to get a reliable picture. If you're interested, you can dig deeper into these key financial trends and insights for the UK.
Comparing Top-Down vs Bottom-Up Forecasting
Choosing between these two isn't just a matter of preference; it’s about picking the right tool for the job. This table breaks down the core differences to help you decide what makes the most sense for your business right now.
| Forecasting Approach | Best For | Pros | Cons |
|---|---|---|---|
| Top-Down | New businesses, market entry analysis, setting high-level targets. | Quick to create, good for seeing the total market potential. | Often overly optimistic, detached from operational reality. |
| Bottom-Up | Established SMEs, operational planning, setting realistic budgets. | Grounded in reality, highly actionable, identifies key business drivers. | More time-consuming to build, can be limited by past performance. |
Ultimately, the best strategy often involves using both. Start with a detailed, realistic bottom-up forecast to guide your operations and budget. Then, create a top-down model to act as a sanity check and to make sure your ambitions are still in line with the larger market opportunity. This dual approach gives you the perfect balance of realism and ambition to drive your business forward.
Building Your First Financial Forecast
Right, let's move from the 'why' to the 'how'. You've got your historical data lined up and a forecasting method in mind, so it's time to roll up your sleeves and actually build the model. If you don't have a finance degree, don't sweat it. This is a logical process we can break down into straightforward pieces.
The visual below maps out the entire journey. It shows how a solid forecast starts by looking at the world outside your business, then narrows in on the specific things you do to make money, long before you even open a spreadsheet.
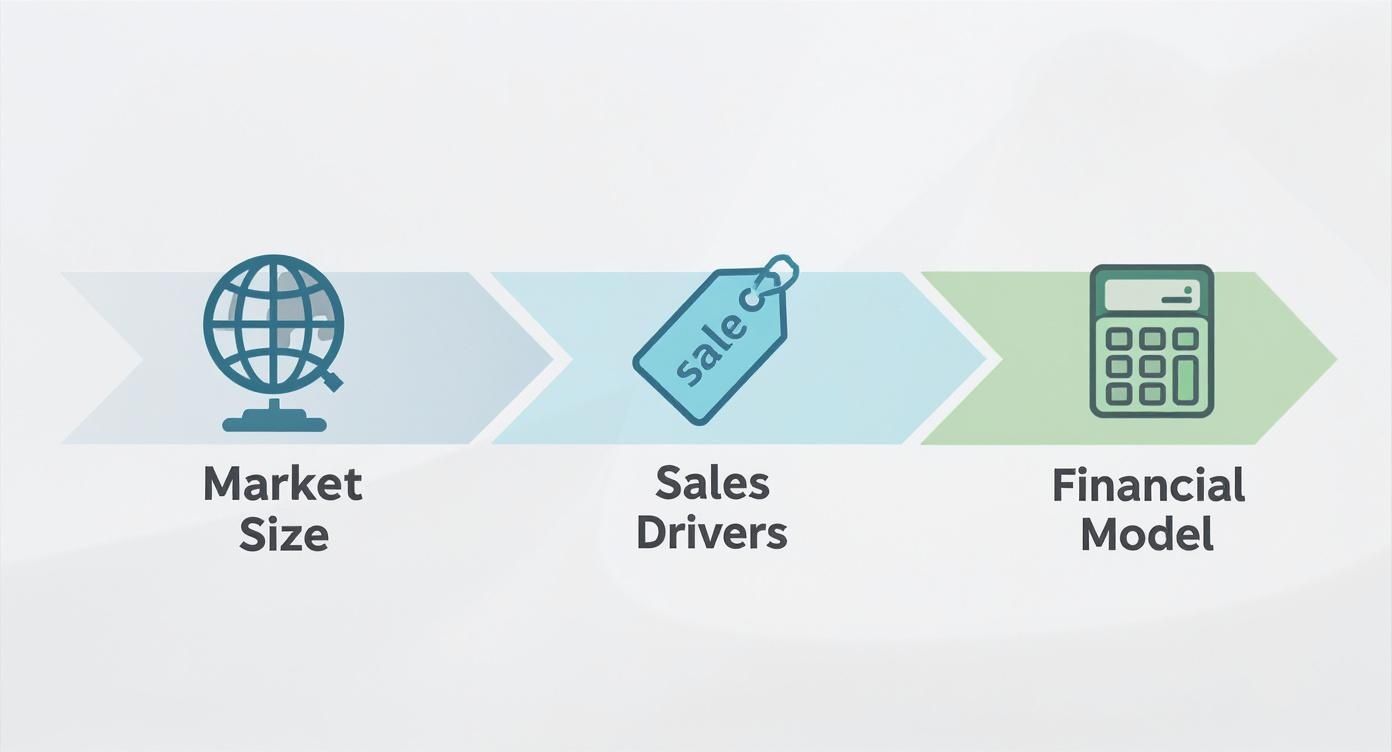
As you can see, it all begins with understanding your market and what drives your sales. Only then can you start plugging in the numbers.
Projecting Your Sales Revenue
Think of your sales forecast as the engine of your entire financial model. Everything else—from staffing costs to your bank balance—stems from the assumptions you make right here. Honestly, this is the single most critical element to get right.
Let's make this real. Imagine you run a digital marketing agency in the UK. Instead of just plucking a revenue figure out of thin air, a bottom-up approach forces you to build your forecast on concrete, controllable drivers:
- Number of clients: How many clients can you realistically serve each month?
- Average monthly retainer: What's the typical fee you're charging?
- Project-based work: How many one-off projects do you expect to win?
Suddenly, your revenue projection has substance. If your goal is to grow from 10 clients to 15 over the next year, with an average retainer of £2,000, your forecast is grounded in a clear business plan.
Calculating Cost of Goods Sold
Once you have a handle on revenue, you need to work out the direct costs of delivering that work. This is your Cost of Goods Sold (COGS)—or for a service business like our agency, the Cost of Sales.
These are the costs that go up and down directly with your workload. For the marketing agency, this would include things like:
- Freelancer Costs: If you bring in contractors for specific client projects, their fees are a direct cost.
- Software Subscriptions: The cost of a specialist analytics tool you only use for one client’s campaign would fit here.
- Ad Spend: Any advertising budget you manage and pass directly to the client is a clear cost of sale.
Subtracting these costs from your revenue gives you your Gross Profit. It’s a crucial number because it tells you how profitable your core services are before you even think about overheads.
Projecting Your Operating Expenses
Next up are your Operating Expenses (OpEx), which are essentially the costs of keeping the lights on. Unlike COGS, these expenses don't really change whether you have one client or twenty. They’re the fixed costs you have to cover no matter what.
Our agency’s OpEx forecast would likely include:
- Salaries and National Insurance: The fixed monthly cost for your permanent team.
- Rent and Utilities: Your office, internet, and electricity bills.
- Marketing and Advertising: Your own budget for promoting the agency itself.
- General Software: Subscriptions for tools like Xero, project management apps, and Microsoft 365.
- Professional Fees: Your accountant's or lawyer's retainer.
Here, it's smart to look beyond your own four walls. Consider how the wider UK economy might affect these costs. For instance, projections for wage inflation or rising energy prices can have a direct impact on your OpEx. Getting this right is a cornerstone of good financial modeling best practices.
Planning for Capital Expenditures
Capital Expenditures (CapEx) are the big-ticket items—significant purchases of assets that will last for more than a year. We're talking about new computers for the team, office furniture, or maybe a company vehicle.
These purchases don't hit your profit and loss account all at once. Instead, they're depreciated over their useful life. However, they have an immediate and significant impact on your cash flow. A new server might be a great investment, but if the purchase drains your bank account, you could be in trouble. Planning for these is vital for survival.
Your financial forecast is an interconnected system. Tweak your sales forecast, and you'll see a ripple effect through your COGS, gross profit, and ultimately, your cash in the bank. Every piece influences the others.
Tying It All Together: The Three Statements
The final stage is to assemble all these moving parts into the three core financial statements. This is where the magic happens, and you get a complete picture of your business's future.
-
The Profit & Loss (P&L): This is where you pull together your revenue, COGS, and OpEx projections to see your forecasted net profit or loss for each month or quarter. It tells you if you're making money.
-
The Balance Sheet: This gives you a snapshot of your company's financial health at a specific point in time, projecting your future assets (what you own) and liabilities (what you owe).
-
The Cash Flow Statement: For any small business, this is arguably the most important forecast of all. It shows how actual cash moves in and out of your business, turning 'profit' on paper into real money in the bank.
To get a much deeper look into this critical document, you should check out our guide on how to create a proper https://stewartaccounting.co.uk/cash-flow-forecast-for-small-business/.
When you build these three statements in tandem, they create a dynamic, 360-degree view of your business's future, giving you a powerful tool to make much smarter decisions.
How to Analyse and Stress-Test Your Forecast

Getting your financial forecast down on paper is a massive step, but that's really just the beginning. A forecast is useless if it just sits in a folder gathering dust. Its real power is unlocked when you treat it as a living, breathing tool—something you constantly question, challenge, and refine. This is how you turn a simple spreadsheet into genuine business intelligence.
The whole point isn't about proving your initial guesses were "right." It's about figuring out why reality was different and using those lessons to make your next forecast that much sharper. Think of it as a continuous cycle: project, measure, and learn.
Embrace Scenario Planning
First things first, let's accept that the future is anything but certain. Your initial forecast is probably built around a 'most likely' outcome, but what if things go much better than expected? More importantly, what happens if they don't? This is where scenario planning becomes your secret weapon.
Instead of clinging to a single forecast, build out three distinct versions. I’ve found this simple exercise to be incredibly revealing, and it’s a cornerstone of solid financial planning.
- Best-Case Scenario: What if you land that huge contract you've been pitching? What if your new marketing campaign brings in 25% more leads than you hoped? This version isn’t just wishful thinking; it shows your growth potential and helps you prepare for scaling up before it happens.
- Worst-Case Scenario: What's the plan if you lose your biggest client tomorrow? Or if a key supplier jacks up their prices by 15%? This is your resilience test. It flags potential cash flow crises well before they hit, giving you time to react.
- Realistic Scenario: This is your original forecast, the middle ground that acts as your operational baseline.
By mapping out these three possibilities, you’re creating a buffer zone. You're no longer just planning for one specific future but preparing your business to adapt, no matter what the market throws at it.
The goal of scenario planning isn’t to perfectly predict the future. It’s to make sure your business isn’t fragile and can survive—or even thrive—when the unexpected happens.
Get to Grips with Variance Analysis
With your different scenarios in place, the next crucial step is a monthly ritual: variance analysis. It's the simple but powerful practice of comparing what you thought would happen last month with what actually happened. Did you hit your sales target? Were expenses higher or lower than planned?
Those gaps between your forecast and reality are the 'variances', and they are pure gold. Digging into them teaches you more about the nuts and bolts of your business than almost anything else. It's not about assigning blame; it’s about discovery.
A variance of just a few percentage points might not seem like a big deal, but it can signal a major shift. Getting the details right is vital everywhere. Just look at the UK public sector, where the Office for Budget Responsibility's forecasts often align almost perfectly with actual borrowing. That level of detail is essential for managing an economy, as tiny deviations can lead to major policy changes. You can dive deeper into these public sector finance statistics to see what I mean.
Ask 'Why?' Behind the Numbers
When you spot a significant variance, it’s time to put on your detective hat. You need to understand why it happened.
If revenue was down, was it because you had fewer leads, a lower conversion rate, or smaller average deal sizes? If your marketing spend shot over budget, which campaign was the culprit?
Every answer sharpens your understanding of the business. You might learn that your sales cycle is a week longer than you thought, or that one marketing channel is way more effective than you assumed. These are the insights that let you tweak your strategy in real-time and, most importantly, make your next forecast far more accurate. This iterative process is what transforms your forecast from a static document into a powerful engine for continuous improvement.
A Few Common Questions About Financial Forecasting
Even with a solid plan, a few practical questions always pop up when you're getting your hands dirty with financial forecasting. It’s one thing to understand the theory, but another to put it into action day-to-day. Let's tackle some of the most common queries I hear from business owners.
Think of this as your go-to FAQ for those moments when you need a quick, straightforward answer to keep things moving.
How Often Should I Be Updating My Financial Forecast?
For most small businesses, the sweet spot is a monthly review paired with a more substantial quarterly update. It's crucial to understand these are two different tasks with different goals.
Your monthly check-in is all about variance analysis. You’re simply comparing your actual numbers for the month against what you forecasted. It’s a quick pulse check to spot any glaring differences and ask, "Why did that happen?" without having to rebuild your entire forecast from scratch.
The quarterly update, on the other hand, is a proper deep dive. This is where you step back and challenge your core assumptions. Has something fundamental shifted in the market? Has a new competitor thrown a spanner in the works? Is one of your key products flying off the shelves faster than you predicted? You'll use these bigger-picture insights to adjust your projections for the rest of the year. Of course, if you're a high-growth startup or in a rapidly changing industry, you might find yourself doing these bigger updates every month.
What Are the Best Forecasting Tools for a Small Business?
Honestly, you can get surprisingly far with a well-built spreadsheet in Excel or Google Sheets. They're flexible and powerful. The main drawback is the reliance on manual data entry, which is where human error tends to creep in.
When you feel you've outgrown your spreadsheet, there are some fantastic tools designed to make your life easier.
- Your Accounting Software: Most modern cloud accounting platforms like Xero and QuickBooks have their own forecasting features built right in. This is a brilliant place to start, as they automatically pull in your real-time financial data, which saves an enormous amount of time.
- Dedicated Forecasting Apps: For businesses that need more sophisticated analysis, tools like Float, Fathom, or LivePlan are a great next step. They sync with your accounting software but give you much more powerful features for scenario planning, creating visual dashboards, and tracking key performance indicators (KPIs).
The right tool for you really comes down to your budget, the complexity of your business, and how much time you want to claw back. My advice? Start with what's already inside your accounting system. You'll know when it's time to upgrade once you start feeling its limitations.
I've seen it time and again: the single biggest mistake is falling for 'optimism bias'. Business owners create a forecast that reflects what they hope will happen, not what the data realistically suggests. This can lead to disastrous cash flow problems when those big sales numbers just don't come through.
What’s the Biggest Mistake Businesses Make When Forecasting?
Aside from that unchecked optimism, the other critical mistake is treating the forecast like a static document you create once and then forget about. So many business owners will build a detailed forecast to secure a business loan, get the money, and then file the forecast away, never to be seen again. This completely misses the whole point.
Your forecast is meant to be a living, breathing guide—your financial roadmap for the journey ahead. It's there to inform your strategic decisions every week, every month. By constantly comparing your actual performance against your forecast, you start to truly understand what drives your business. It allows you to make smarter, faster decisions.
So, ground your assumptions in real historical data, stress-test them by modelling different scenarios, and, most importantly, make reviewing your forecast a non-negotiable part of your business routine.
Feeling a bit lost in the numbers? At Stewart Accounting Services, we specialise in helping business owners across the UK build and analyse financial forecasts that actually drive growth. Let us manage the details so you can get back to leading your business with confidence. Find out how we can help you achieve financial clarity.