

Creating financial projections is all about turning your business strategy into a tangible set of numbers. It’s about forecasting your future income, outgoings, and cash flow. The whole process kicks off with a realistic sales forecast. From there, you build out your profit and loss statement, cash flow statement, and balance sheet—all built on a bedrock of clear, documented assumptions.
Your Blueprint for Business Growth
Let's be clear: financial projections are not just a numbers exercise. They're the strategic blueprint for your SME's future. Forget the accounting jargon for a moment. Having a clear financial vision empowers you to make those crucial decisions, whether it's hiring your next team member or investing in new equipment. It's what separates a business that just reacts to events from one that proactively shapes its own destiny.
Solid projections give you the clarity you need to secure funding, manage your cash flow without sleepless nights, and scale your business with real confidence. For most business owners I talk to, this roadmap is what answers their most pressing questions about long-term sustainability and growth.
This process transforms abstract goals into concrete, measurable steps. It helps you gain:
- More Time: You'll make quicker, more informed decisions.
- More Money: You can allocate resources better and spot what's really driving profit.
- A Clearer Mind: You'll have the peace of mind that comes with a solid plan.
The infographic below shows how these financial projections lay the groundwork for smart decision-making, securing the right funding, and ultimately, achieving scalable growth.
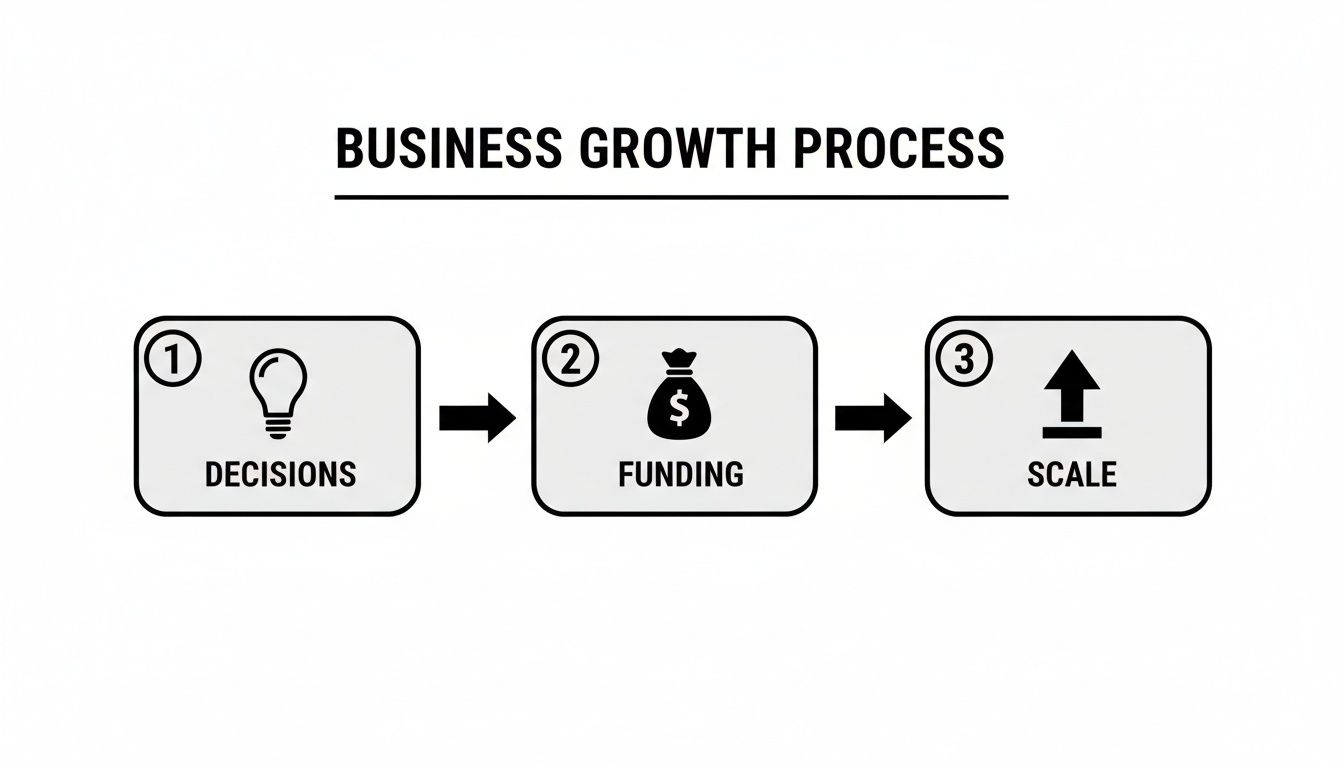
As you can see, each stage builds on the last. That clear financial insight is what drives every strategic move forward.
Turning Vision into Viability
Think of your projections as the bridge connecting your brilliant business idea to its profitable reality. When you're talking to investors or the bank, these are the numbers they look at first because they tell the real story of how you think about your business. A well-crafted forecast demonstrates that you understand market realities and the fundamentals of your operation—it shows you’ve done your homework.
A strong forecast doesn't just predict the future; it helps you create it. It validates your business model by proving its unit economics and scalability, reflecting sound strategic thinking and financial discipline.
To get this right, your projections absolutely must be built on credible assumptions. This means digging into your historical data, getting a handle on market trends, and being brutally honest about your growth potential. For a deeper dive into this foundational element, you can learn more about how to build a strong financial strategy for long-term business growth. This strategic underpinning is what gives your numbers meaning and turns a spreadsheet into a powerful management tool. Without it, you're essentially flying blind.
Laying the Groundwork for Your Sales Forecast

Your sales forecast is the absolute cornerstone of your financial projections. It's the engine that drives everything else – your profit and loss, your balance sheet, and most importantly, your cash flow. If you get this bit wrong, the rest of your numbers, no matter how neatly presented, will be built on sand.
Getting this right isn't about guesswork. It’s a structured process of setting down solid, defensible assumptions based on what you know: historical data, what’s happening in your market, and where you want to take the business. The goal is to land on a forecast that’s both aspirational and anchored in reality.
Choosing Your Forecasting Approach
Broadly speaking, there are two ways to tackle a sales forecast: top-down or bottom-up. Neither is inherently superior; the best fit really depends on your business and the information you have to hand.
A top-down forecast starts big. You look at the total market size and then estimate the slice of the pie you can realistically capture. Imagine a new craft brewery in Scotland. They might look at the entire UK craft beer market and project they can capture a tiny fraction, say 0.01%, in their first year. This is a common starting point for new ventures without any sales history, but it can feel a bit theoretical.
On the other hand, a bottom-up forecast is built from the ground up, using your own operational data. It’s far more tangible. A contractor based in Stirling would use this method by looking at their project pipeline, their historic quote-to-win rate, and the average value of a job to build a picture of future revenue.
For most established SMEs, a bottom-up forecast is the more reliable route. It forces you to think practically about your capacity, your team’s performance, and your marketing efforts, directly linking your sales targets to the real-world activities needed to hit them.
In practice, the strongest forecasts often blend both approaches. You could build your forecast from the bottom up and then sense-check it against a top-down view to make sure your ambitions are plausible within the wider market.
Documenting Your Core Assumptions
Every single number in your sales forecast must be backed by a clear assumption. This is non-negotiable. When you write these down, your forecast transforms from a static spreadsheet into a living, dynamic tool that you can tweak as things change.
Here are the key things you need to put a number on:
- Pricing: What are you charging? Make sure to document any planned price rises or promotional discounts. Getting this right is fundamental, and you can delve deeper into valuing and pricing goods and services to solidify this part of your plan.
- Sales Volume: How many units will you sell, or how many clients will you serve? A product-based business will break this down by product line. A service provider might think in terms of billable hours or completed projects.
- Seasonality: Does your business have predictable busy and quiet periods? A London retailer will gear up for a Q4 surge, while a landscape gardener knows the phone will ring off the hook in spring. Look at your past data to apply realistic seasonal swings.
- Market Growth: What's the economic climate like? The UK business landscape is always shifting. For instance, SMEs accounted for 99.9% of the 5.68 million private sector businesses at the start of 2025. By Q3 2025, UK business investment had jumped 1.5% quarter-on-quarter, signalling real confidence and opportunity. Weaving this context into your projections makes them much more robust. You can find more details in the UK business population estimates on GOV.UK.
- Sales and Marketing Impact: What return are you expecting from your sales efforts? If you’re hiring a new salesperson in month six, what uplift in leads and conversions do you anticipate? If you double your ad budget, what’s the expected result?
To bring this to life, let’s look at the key components needed to build a forecast.
Key Components of a Sales Forecast
Building a reliable sales forecast means breaking it down into manageable, evidence-based pieces. The table below outlines the essential inputs you'll need to consider, with a practical example for a small UK e-commerce business selling handmade leather goods.
| Component | Description | Example for a UK SME |
|---|---|---|
| Pricing Strategy | The price point for each product or service, including any planned discounts or future increases. | £75 average order value (AOV), based on the last 12 months of sales data pulled from their Xero account. |
| Sales Channels | The different avenues through which you generate sales (e.g., website, retail, direct sales). | 90% of sales via their e-commerce website, 10% from occasional market stalls. |
| Sales Volume | The number of units or services you expect to sell, often broken down by channel or product line. | Forecast based on 5,000 monthly website visitors and a 2.0% historical conversion rate. |
| Marketing Drivers | Specific activities planned to drive sales, such as new advertising campaigns or hiring salespeople. | A new PPC campaign is launching in Q2, expected to increase traffic by 20% with a 1.8% conversion rate. |
| External Factors | Market trends, economic conditions, and seasonality that will influence demand. | A 15% sales uplift is projected for the November-December Christmas shopping period, based on past years. |
By documenting these details, the business owner can clearly see which levers they can pull. If the new marketing campaign underperforms, they can immediately adjust their forecast and make informed decisions, which is precisely the point of this whole exercise.
Building Your Profit and Loss Projection

With a solid sales forecast in hand, you're ready to tackle the next critical piece of your financial puzzle: the Profit and Loss (P&L) projection. This is where the rubber meets the road. It’s a straightforward statement that pits your anticipated income against all your costs, giving you a clear view of your expected profitability.
Think of the P&L as the story of your business's health over a period. It goes beyond just looking at the sales figures and forces you to get honest about every single expense. This isn't just a box-ticking exercise; it’s vital for making smart decisions, spotting where costs might be getting out of hand, and finding ways to work more efficiently.
Differentiating Your Costs
The first thing to do when building your P&L is to split your expenses into two main camps: Cost of Goods Sold (COGS) and Operating Expenses (OpEx). It might sound like accounting jargon, but getting this right is crucial because it directly affects your gross and operating profit—two of the most important numbers for understanding your performance.
Cost of Goods Sold (COGS)
These are the direct costs of what you sell. If you’re a retailer, it’s the price you paid for the stock you sold. If you’re a manufacturer, it’s the raw materials and the direct labour that went into making the product. For a service business, it could be the salary of the consultant delivering the work or the software licence needed for a specific client project.
Operating Expenses (OpEx)
These are the overheads—the costs of keeping the lights on, regardless of how much you sell. They’re often grouped into categories like Sales & Marketing, General & Administrative (G&A), and maybe Research & Development (R&D) if that applies to you.
Splitting them out lets you calculate your gross profit (Revenue – COGS). This number tells you how efficiently you’re producing your goods or services before any overheads are factored in.
Projecting Fixed vs Variable Costs
Drilling down further, your operating expenses will be a mix of fixed and variable costs. Being able to forecast these accurately is what makes a financial projection genuinely useful.
-
Fixed Costs: These are the predictable ones. They stay the same every month, whether you have a record sales month or a quiet one. Think of your office rent in Falkirk, salaried payroll, insurance, and your accounting fees. They form the stable bedrock of your budget.
-
Variable Costs: These move in line with your business activity. More sales usually mean higher variable costs. Classic examples are sales commissions, hourly wages for extra staff during busy periods, or your pay-per-click advertising spend.
A sole trader might have fixed costs like their Xero or Adobe software subscriptions, while their variable costs could include things like their mobile phone bill, which fluctuates with usage.
A common mistake I see is business owners treating all costs as fixed. When you separate out the variable costs, you can instantly see how your profit margin changes at different sales volumes. This is gold dust when you get to scenario planning.
For a deeper dive into this, it’s well worth looking at guides on planning your business budget, which can provide a really solid framework.
Factoring in the Economic Climate
Your projections don't exist in a bubble. They’re subject to the whims of the wider UK economy. Things like inflation, interest rates, and national growth will inevitably affect your costs, from supplier prices to staff wages. Ignore them at your peril.
Keeping an eye on the bigger picture gives your numbers vital context. For example, the OBR's November 2025 Economic and Fiscal Outlook projects real GDP growth at 1.5% for 2025. Meanwhile, the Bank of England anticipates the Bank Rate to be around 3.6% in two years. It's smart to build these kinds of assumptions into your models for things like payroll, CIS, and auto-enrolment contributions.
Constructing Your P&L Statement
Once you’ve got all your costs listed and categorised, putting the P&L projection together is a logical process:
- Start with Total Revenue: This number comes straight from your sales forecast.
- Subtract COGS: This leaves you with your Gross Profit.
- Subtract Operating Expenses: Tally up all your fixed and variable OpEx. Subtracting them from the gross profit gives you your Operating Profit (often called EBIT – Earnings Before Interest and Taxes).
- Subtract Interest and Taxes: This final step gives you the bottom line: your Net Profit.
Your own historical data is your best friend here. Pull up your past P&L statements from your accounting software to get a baseline for each expense line. If you’re a new business without that history, industry benchmarks are a decent starting point, but be ready to refine your numbers as soon as you have your own real-world data to work with.
Getting to Grips with Your Cash Flow Forecast
I’ve seen it countless times: a business looks great on the P&L statement but is teetering on the edge of collapse. Why? Because profit on a spreadsheet doesn't pay the bills—cash in the bank does. This is probably the most crucial lesson in business finance.
Your cash flow forecast is the true heartbeat of your business. It tracks the actual money moving in and out of your account, which is often a very different story from the theoretical profitability shown on your Profit and Loss.
Many businesses that were technically profitable have gone under simply because they ran out of cash. It’s vital to grasp the difference. Your P&L might show a big sale in March, but if that client has 60-day payment terms, you won't see a penny until May. That's a two-month gap you have to survive.
From Profit to Real-World Cash
The first thing to do is translate your P&L into a realistic cash projection. This is all about adjusting for the timing differences and non-cash items that a P&L ignores. You're mapping out when the money actually arrives and when it actually leaves.
Start with your projected monthly revenue. If you offer clients 30-day terms, you need to shift that income forward. Cash from January's sales won't land in your bank until February. Model this lag accurately for every single month.
Next, do the same for your outgoings.
- Supplier Payments: When do you physically pay your suppliers? If you’re on 30-day terms with them, a cost incurred in March might not be a cash outflow until April.
- VAT Payments: This is a classic cash flow trap. You collect VAT from customers as you go, but you only hand it over to HMRC quarterly. That money sits in your account, but it isn't yours. You must forecast that big lump-sum payment.
- Corporation Tax: Similarly, corporation tax is paid long after the profit is earned. It’s a major cash outflow that can catch you by surprise if you haven't planned for it.
- Salaries & Payroll Taxes: These are usually a bit simpler, as they're typically paid in the same month they are incurred.
Making these timing adjustments alone will give you a much clearer picture of your month-to-month cash position. For a more detailed walkthrough, our guide on creating a cash flow forecast for small business is a great next step.
Accounting for Major Cash Movements
Beyond the regular operational timings, your forecast must include significant cash movements that don't appear on your P&L at all. These are often the very things that cause a sudden, unexpected cash crunch.
Be sure to include these big-ticket items:
- Capital Investments: Buying new equipment or a company vehicle is a huge cash outflow.
- Loan Repayments: The principal part of a loan repayment is a cash expense, but it isn't a P&L expense (only the interest is).
- Director's Loans: Any money you put into or take out of the business needs to be tracked here.
- Asset Sales: On the flip side, selling an old van or piece of machinery brings in a welcome injection of cash.
For SMEs across Central Scotland and the UK, solid cash flow projections are fundamental to scaling towards that seven-figure mark. Official estimates show SMEs drive a staggering £2.83 trillion in turnover. And while external finance use dipped slightly in 2024, gross bank lending still hit £62 billion. Factoring in these bigger financial movements is critical for survival and growth.
Seeing Around Corners with Scenarios
This is where your cash flow forecast transforms from a simple report into a powerful strategic tool. Once you have your baseline projection, you can start playing "what if?"
What happens if a major client pays 30 days late? What if your main supplier hikes their prices by 10%?
By modelling these scenarios, you can spot potential cash crunches months before they hit. This gives you precious time to react—maybe by arranging an overdraft, chasing invoices more aggressively, or delaying a non-essential purchase. It's like having a crystal ball for your bank account.
This process empowers you to see around corners and make smarter decisions every day. Although the context is different, the underlying principles are universal, as you can see by exploring what cash flow in real estate is and how to calculate it. Ultimately, mastering your forecast is how you build a resilient business that can weather any storm.
Stress-Testing Your Numbers with Scenario Analysis

Let’s be honest, a single financial projection is just one version of the future. It's an educated guess. While building that solid forecast is the essential first step, genuine strategic planning means being ready for more than one outcome. Relying on a single set of numbers is a bit like driving down the motorway staring only at the car directly in front – you're completely blind to what might be coming up in the other lanes.
This is where scenario analysis makes all the difference. It’s a powerful technique that turns your static spreadsheet into a dynamic tool for managing risk and spotting opportunities. We’re not talking about gazing into a crystal ball here. It’s about understanding how your business would actually hold up under different conditions, giving you the resilience to handle whatever comes your way.
The Three Core Scenarios to Model
To get a proper 360-degree view of your potential financial future, you need to build out at least three versions of your projections. It's an exercise that forces you to think critically about what really drives your business and what could realistically push those drivers in a different direction.
Your three core scenarios should be:
- Base Case: This is your most likely, "business as usual" forecast. You build it using the solid, well-researched assumptions you've already put together for your sales and costs.
- Optimistic Case (Best Case): This is your blue-sky thinking. What if that big contract you're pitching for actually lands? Or your new marketing campaign wildly overperforms?
- Pessimistic Case (Worst Case): This is the one that might keep you up at night, but it's arguably the most important one to build. What’s the real impact if you lose your biggest client, or a key supplier suddenly bumps their prices by 20%?
By modelling these different outcomes, you can clearly see the potential range of your profitability and, more importantly, your cash position. It prepares you for uncertainty and gives your business a much stronger footing, whatever the economic climate.
Identifying Your Key Drivers
For your scenarios to be meaningful, you need to pinpoint the variables that have the biggest impact on your bottom line. These are the levers you’ll adjust in your optimistic and pessimistic models. For most SMEs, these drivers usually fall into a few key categories.
Common variables to test include:
- Sales Volume: What happens to your cash flow if customer orders drop by 15%?
- Pricing: What's the bottom-line impact of a 10% price cut to fend off a new competitor?
- Customer Acquisition Cost (CAC): What if your marketing costs double to bring in the same number of leads?
- Key Client Dependency: Model the sudden loss of your largest account, which might make up 30% of your revenue.
- Supplier Costs: How does a major price hike from a critical supplier squeeze your gross margin?
Pick two or three of the most critical variables for your specific business and build your scenarios around those. This keeps the whole analysis focused and, most importantly, actionable.
A Practical Scenario Example
Let's picture a small digital marketing agency based in Stirling. Their base case projects steady client growth and stable contractor costs. Pretty standard stuff.
For their optimistic scenario, they model winning a large retainer contract worth an extra £5,000 per month, starting in the third quarter. This instantly reveals a significant jump in net profit and a much healthier cash balance by the end of the year. This insight might just be the push they need to invest more in their sales process to chase similar large accounts.
Now for the pessimistic scenario. They model losing their oldest client, who accounts for 25% of their monthly turnover. On top of that, they factor in a 15% increase in freelance contractor rates due to high demand in the market. The model immediately throws up a red flag: a potential cash flow crunch around month seven.
Seeing this potential shortfall months in advance is the entire point of the exercise. It gives the agency owner time to act—perhaps by securing an overdraft facility, cutting back on non-essential spending, or pushing hard on new business activities to fill that revenue gap.
This process transforms your financial projections from a simple forecast into a powerful navigation tool. You're no longer just guessing; you're preparing. It gives you the confidence to make proactive decisions and ensures your business is ready for both the challenges and the opportunities that lie ahead.
Common Questions About Financial Projections
Even with a solid plan in hand, building your first set of financial projections always brings up a few practical questions. It’s completely normal.
Below, I’ve answered some of the most common queries we get from business owners, tackling the real-world challenges of creating, using, and maintaining forecasts that actually work.
How Often Should I Update My Projections?
Think of your projections as a living document, not something you create once and file away. For most SMEs, a quarterly review is the perfect rhythm. It’s frequent enough to spot trends and make course corrections without being overwhelming. This is your chance to compare your actual performance against the forecast and see what’s really going on.
That said, you’ll want to do a more thorough, deep-dive update at least annually. You should also revisit the numbers immediately if a major event occurs – think landing a game-changing contract, losing a key client, or a supplier suddenly hiking their prices. Keeping your projections fresh ensures you’re always making decisions based on the most current reality.
What Is the Difference Between a Budget and a Projection?
It's a great question, as the terms are often muddled. The simplest way to remember it is that a budget is your plan, while a projection is your prediction.
-
A budget is what you want to happen. It sets financial goals and spending limits for a period, like the upcoming financial year. It's an internal target you actively work towards to manage your resources effectively.
-
A financial projection, on the other hand, is an estimate of what you think is likely to happen. It’s based on past performance, your current pipeline, and your best assumptions about the future.
In practice, you use your projections to test if your budget is realistic. They’re two sides of the same coin, working together to guide your financial strategy.
Can I Create Projections Myself or Do I Need an Accountant?
You can absolutely get started on your own. In fact, I encourage it. Using a good spreadsheet template or the forecasting tools in accounting software like Xero is a fantastic way to get under the bonnet of your business's finances. It forces you to understand the numbers that drive everything else.
However, there comes a point where bringing in a professional makes a lot of sense. If you need projections for a bank loan, are looking to attract investors, or as your business just becomes more complex, an accountant adds a vital layer of credibility. We can stress-test your assumptions, ensure all the statements (P&L, cash flow, and balance sheet) tie up correctly, and spot things you might have missed.
What Are the Most Common Mistakes to Avoid?
I’ve seen a few recurring tripwires over the years. The biggest one by far is runaway optimism in the sales forecast. It’s easy to get excited, but your revenue figures need to be grounded in reality and backed by solid assumptions.
Another classic is underestimating expenses. People often forget to account for things like tax liabilities, the impact of seasonality, or one-off capital purchases that can drain cash.
And that brings me to the most critical mistake: confusing profit with cash. A business can be profitable on paper but go under because it runs out of cash. Your cash flow forecast is non-negotiable. Finally, make sure you write down your assumptions! If you don't, reviewing and updating your projections later becomes a guessing game.
Navigating the world of financial projections can feel daunting, but you don't have to tackle it alone. At Stewart Accounting Services, we specialise in helping SMEs across Central Scotland and the UK build credible, actionable forecasts that drive real growth. Find out how we can give you more time, more money, and a clearer mind.